
- Start >
- Rivers >
- Discharge >
- Oberer Main - Elbe >
- Muggendorf >
- Chart of year

Chart of year Muggendorf / Wiesent
Discharge from 23.09.2019 to 22.09.2020
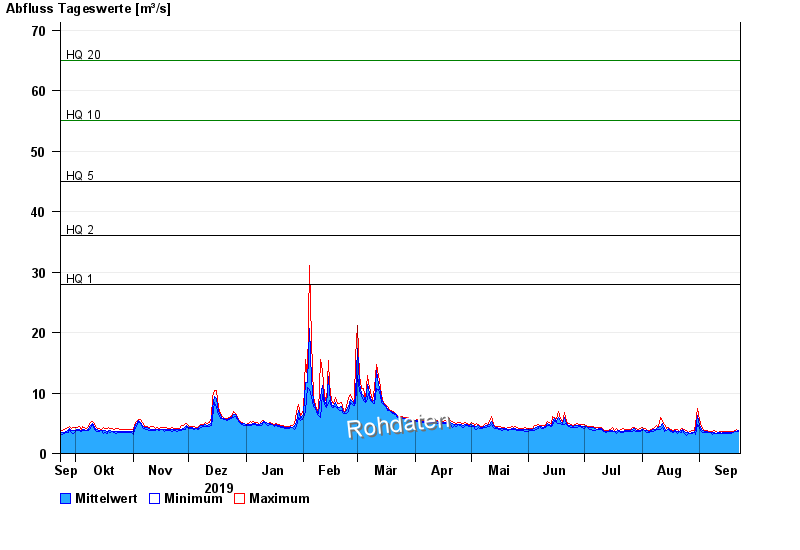
- HQ1 28 m³/s
- HQ2 36 m³/s
- HQ5 45 m³/s
- HQ10 55 m³/s
- HQ20 65 m³/s
- HQ50 80 m³/s
- HQ100 90 m³/s
| Date | Mean value [m³/s] | Maximum [m³/s] | Minimum [m³/s] |
|---|---|---|---|
| 22.09.2020 | 3.77 | 3.87 | 3.71 |
| 21.09.2020 | 3.7 | 3.92 | 3.56 |
| 20.09.2020 | 3.64 | 3.86 | 3.58 |
| 19.09.2020 | 3.53 | 3.68 | 3.4 |
| 18.09.2020 | 3.46 | 3.6 | 3.35 |
| 17.09.2020 | 3.48 | 3.66 | 3.3 |
| 16.09.2020 | 3.47 | 3.64 | 3.27 |
© Bayerisches Landesamt für Umwelt 2024