
- Start >
- Rivers >
- Discharge >
- Oberer Main - Elbe >
- Muggendorf >
- Chart of year

Chart of year Muggendorf / Wiesent
Discharge from 23.09.2020 to 22.09.2021
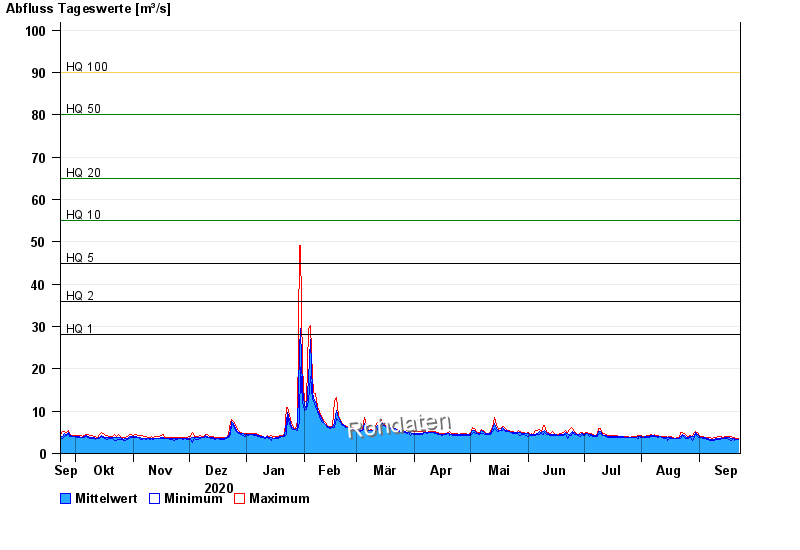
- HQ1 28 m³/s
- HQ2 36 m³/s
- HQ5 45 m³/s
- HQ10 55 m³/s
- HQ20 65 m³/s
- HQ50 80 m³/s
- HQ100 90 m³/s
| Date | Mean value [m³/s] | Maximum [m³/s] | Minimum [m³/s] |
|---|---|---|---|
| 22.09.2021 | 3.42 | 3.65 | 3.27 |
| 21.09.2021 | 3.39 | 3.5 | 3.26 |
| 20.09.2021 | 3.5 | 3.78 | 3.17 |
| 19.09.2021 | 3.57 | 3.83 | 3.43 |
| 18.09.2021 | 3.65 | 4.02 | 3.14 |
| 17.09.2021 | 3.69 | 4.06 | 3.31 |
| 16.09.2021 | 3.73 | 3.96 | 3.59 |
© Bayerisches Landesamt für Umwelt 2024