
- Start >
- Rivers >
- Discharge >
- Oberer Main - Elbe >
- Laufermühle >
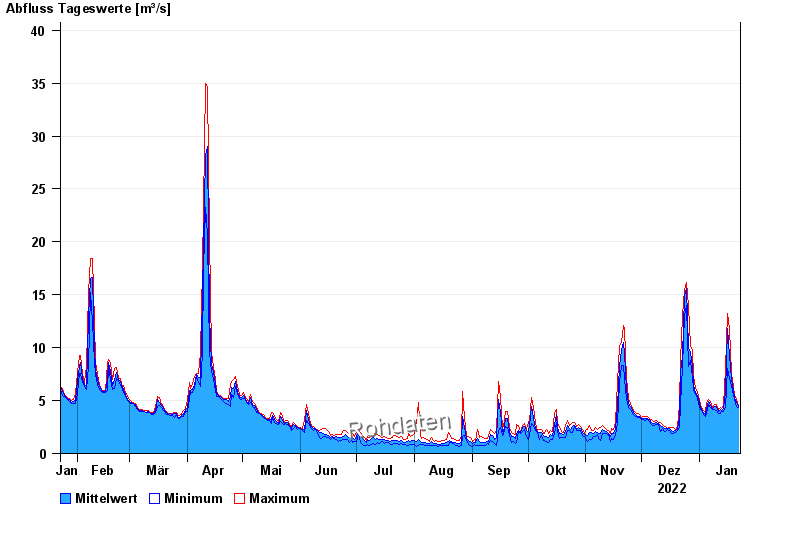
- Chart of year

Chart of year Laufermühle / Aisch
Discharge from 23.01.2022 to 22.01.2023
| Date | Mean value [m³/s] | Maximum [m³/s] | Minimum [m³/s] |
|---|---|---|---|
| 22.01.2023 | 4.41 | 4.53 | 4.34 |
| 21.01.2023 | 4.84 | 5.13 | 4.47 |
| 20.01.2023 | 5.2 | 5.46 | 5.06 |
| 19.01.2023 | 5.93 | 6.34 | 5.46 |
| 18.01.2023 | 6.99 | 7.54 | 6.41 |
| 17.01.2023 | 9.28 | 11.8 | 7.1 |
| 16.01.2023 | 11.8 | 13.2 | 8.05 |
© Bayerisches Landesamt für Umwelt 2024