
- Start >
- Rivers >
- Discharge >
- Oberer Main - Elbe >
- Laufermühle >
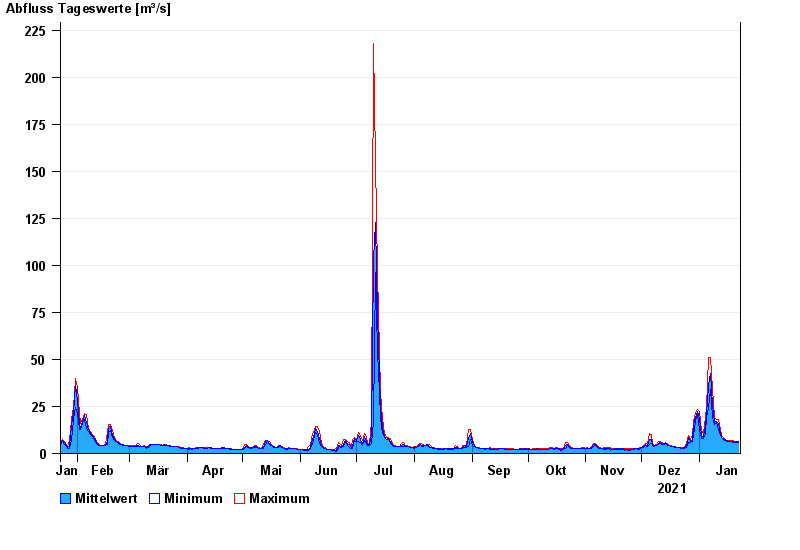
- Chart of year

Chart of year Laufermühle / Aisch
Discharge from 23.01.2021 to 22.01.2022
| Date | Mean value [m³/s] | Maximum [m³/s] | Minimum [m³/s] |
|---|---|---|---|
| 22.01.2022 | 6.12 | 6.32 | 5.97 |
| 21.01.2022 | 6.31 | 6.39 | 6.04 |
| 20.01.2022 | 6.26 | 6.39 | 6.11 |
| 19.01.2022 | 6.37 | 6.68 | 6.11 |
| 18.01.2022 | 6.53 | 6.75 | 6.33 |
| 17.01.2022 | 6.39 | 6.68 | 6.26 |
| 16.01.2022 | 6.73 | 7.01 | 6.47 |
© Bayerisches Landesamt für Umwelt 2024