
- Start >
- Rivers >
- Discharge >
- Oberer Main - Elbe >
- Hohenberg >
- Chart of year

Chart of year Hohenberg / Eger
Discharge from 07.06.2023 to 06.06.2024
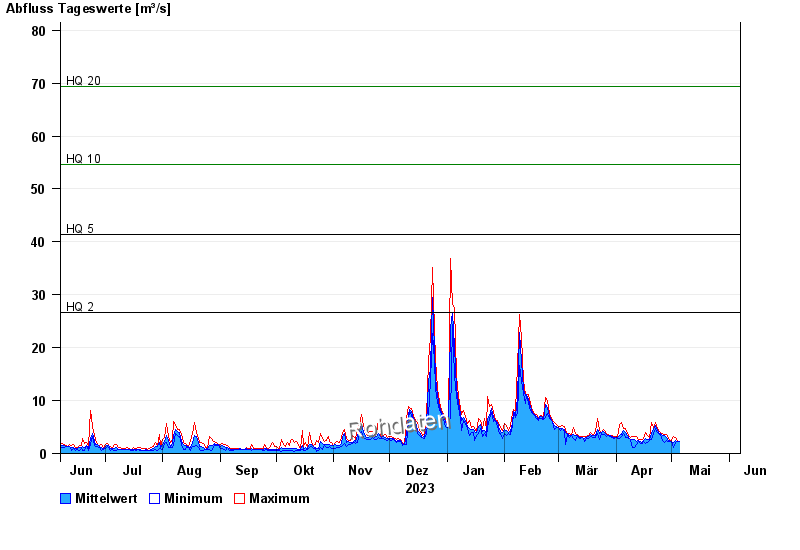
- HQ2 26,6 m³/s
- HQ5 41,3 m³/s
- HQ10 54,6 m³/s
- HQ20 69,4 m³/s
- HQ50 91,5 m³/s
- HQ100 112 m³/s
| Date | Mean value [m³/s] | Maximum [m³/s] | Minimum [m³/s] |
|---|---|---|---|
| 26.04.2024 | 3.51 | 3.51 | 3.51 |
| 25.04.2024 | 3.69 | 3.91 | 3.51 |
| 24.04.2024 | 3.98 | 4.32 | 3.7 |
| 23.04.2024 | 4.75 | 5.09 | 4.21 |
| 22.04.2024 | 5.24 | 5.92 | 4.65 |
| 21.04.2024 | 4.48 | 4.97 | 3.7 |
| 20.04.2024 | 3.7 | 5.8 | 2.59 |
© Bayerisches Landesamt für Umwelt 2024