
- Start >
- Rivers >
- Discharge >
- Oberer Main - Elbe >
- Hohenberg >
- Chart of year

Chart of year Hohenberg / Eger
Discharge from 07.06.2022 to 06.06.2023
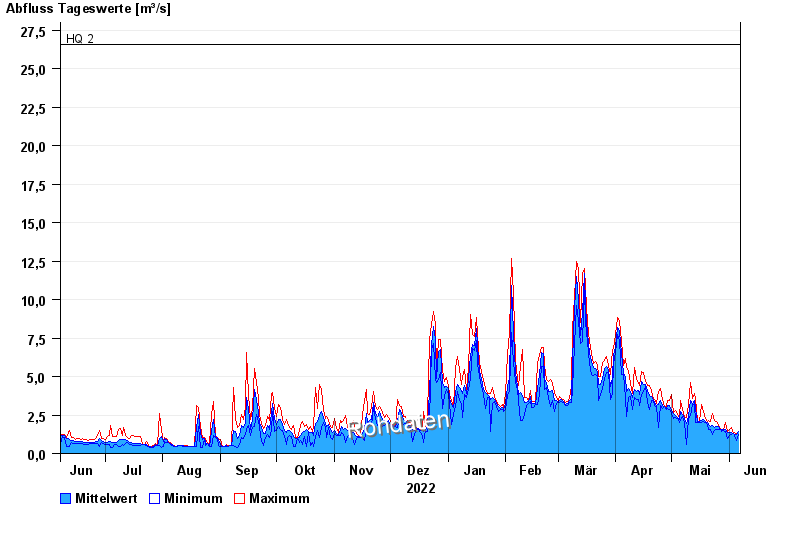
- HQ2 26,6 m³/s
- HQ5 41,3 m³/s
- HQ10 54,6 m³/s
- HQ20 69,4 m³/s
- HQ50 91,5 m³/s
- HQ100 112 m³/s
| Date | Mean value [m³/s] | Maximum [m³/s] | Minimum [m³/s] |
|---|---|---|---|
| 06.06.2023 | 1.4 | 1.45 | 1.26 |
| 05.06.2023 | 1.22 | 1.32 | 0.843 |
| 04.06.2023 | 1.26 | 1.38 | 1.15 |
| 03.06.2023 | 1.32 | 1.32 | 1.32 |
| 02.06.2023 | 1.39 | 1.72 | 1.26 |
| 01.06.2023 | 1.35 | 1.58 | 1.15 |
| 31.05.2023 | 1.37 | 1.45 | 0.988 |
© Bayerisches Landesamt für Umwelt 2024