
- Start >
- Rivers >
- Discharge >
- Oberer Main - Elbe >
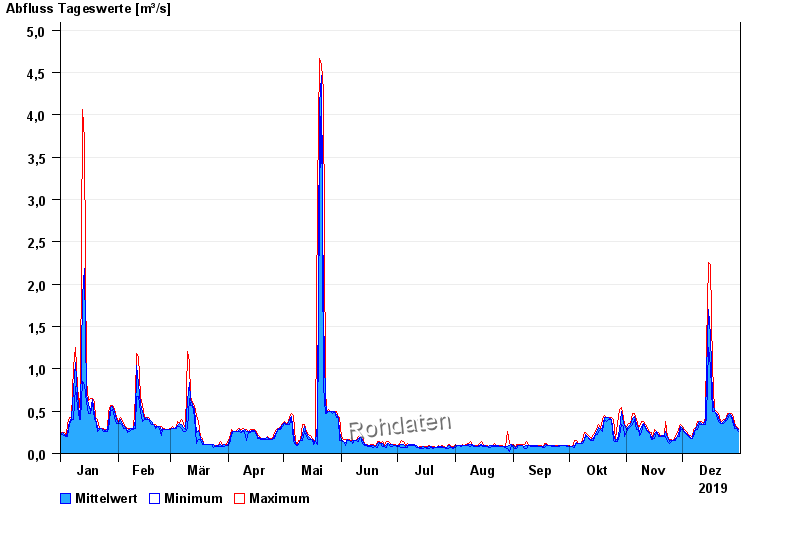
- Goldbergsee Ablauf >
- Chart of year

Chart of year Goldbergsee Ablauf / Sulzbach
Discharge from 01.01.2019 to 31.12.2019
note
Beeinflussung des Abflusses aufgrund Hindernisse im Unterlauf.
| Date | Mean value [m³/s] | Maximum [m³/s] | Minimum [m³/s] |
|---|---|---|---|
| 31.12.2019 | 0.285 | 0.299 | 0.262 |
| 30.12.2019 | 0.306 | 0.318 | 0.299 |
| 29.12.2019 | 0.335 | 0.359 | 0.299 |
| 28.12.2019 | 0.383 | 0.424 | 0.338 |
| 27.12.2019 | 0.449 | 0.47 | 0.424 |
| 26.12.2019 | 0.47 | 0.47 | 0.446 |
| 25.12.2019 | 0.444 | 0.47 | 0.401 |
© Bayerisches Landesamt für Umwelt 2024