
- Start >
- Rivers >
- Discharge >
- Oberer Main - Elbe >
- Goldbergsee Ablauf >
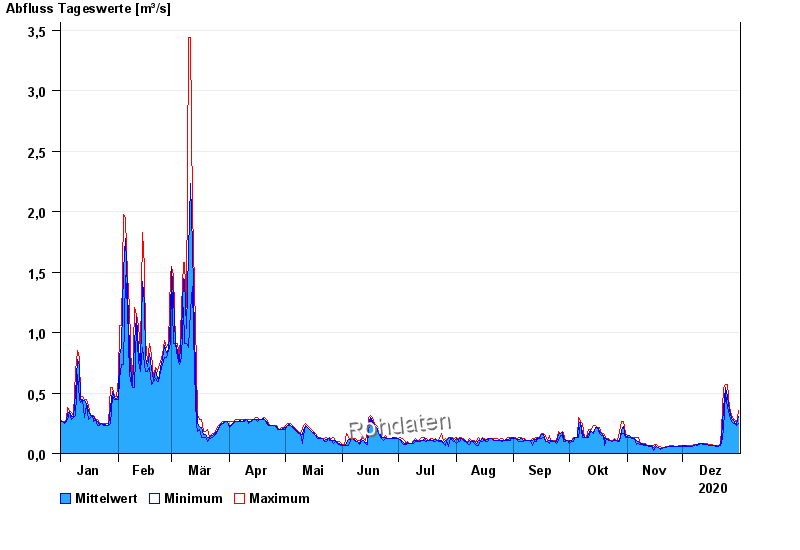
- Chart of year

Chart of year Goldbergsee Ablauf / Sulzbach
Discharge from 01.01.2020 to 31.12.2020
note
Beeinflussung des Abflusses aufgrund Hindernisse im Unterlauf.
| Date | Mean value [m³/s] | Maximum [m³/s] | Minimum [m³/s] |
|---|---|---|---|
| 31.12.2020 | 0.31 | 0.359 | 0.244 |
| 30.12.2020 | 0.243 | 0.244 | 0.228 |
| 29.12.2020 | 0.254 | 0.279 | 0.244 |
| 28.12.2020 | 0.269 | 0.279 | 0.244 |
| 27.12.2020 | 0.293 | 0.318 | 0.262 |
| 26.12.2020 | 0.355 | 0.38 | 0.318 |
| 25.12.2020 | 0.471 | 0.571 | 0.38 |
© Bayerisches Landesamt für Umwelt 2024