
- Start >
- Rivers >
- Discharge >
- Oberer Main - Elbe >
- Gampelmühle >
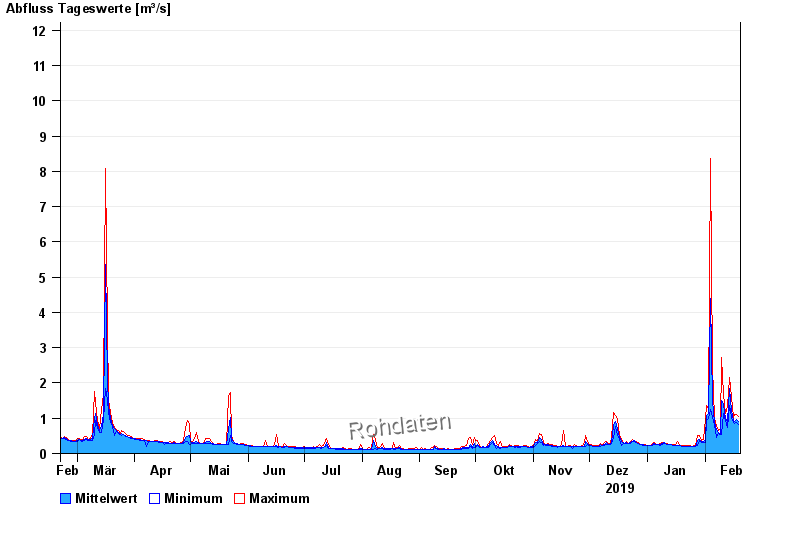
- Chart of year

Chart of year Gampelmühle / Ölschnitz
Discharge from 20.02.2019 to 19.02.2020
- 06.06.1984 Abfluss: 25,5 m³/s
- 16.08.1972 Abfluss: 20,4 m³/s
- 23.02.1970 Abfluss: 19,8 m³/s
- 26.01.1995 Abfluss: 19,7 m³/s
- 28.05.2006 Abfluss: 18,5 m³/s
| Date | Mean value [m³/s] | Maximum [m³/s] | Minimum [m³/s] |
|---|---|---|---|
| 19.02.2020 | 0.912 | 1.05 | 0.813 |
| 18.02.2020 | 0.962 | 1.11 | 0.87 |
| 17.02.2020 | 0.919 | 1.11 | 0.839 |
| 16.02.2020 | 0.936 | 1.02 | 0.87 |
| 15.02.2020 | 1.22 | 1.58 | 1.02 |
| 14.02.2020 | 1.84 | 2.15 | 1.36 |
| 13.02.2020 | 0.919 | 1.33 | 0.728 |
© Bayerisches Landesamt für Umwelt 2024