
- Start >
- Rivers >
- Discharge >
- Oberer Main - Elbe >
- Gampelmühle >
- Chart of year

Chart of year Gampelmühle / Ölschnitz
Discharge from 20.02.2020 to 19.02.2021
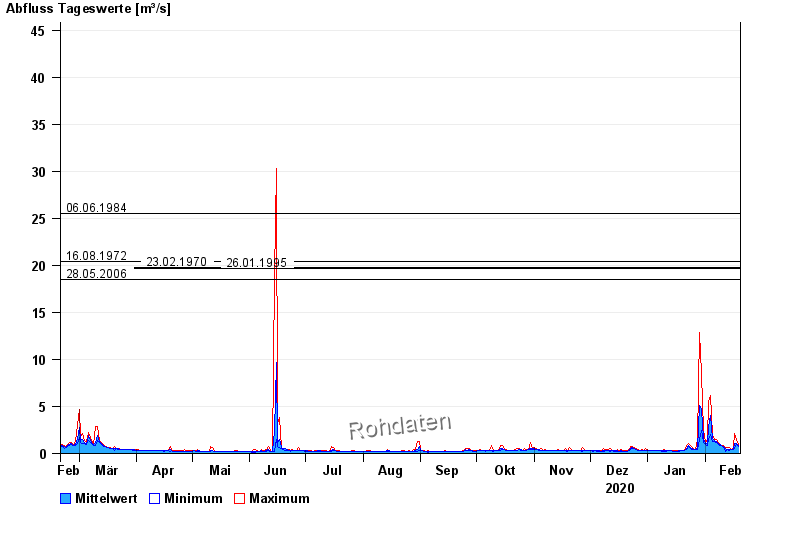
- 06.06.1984 Abfluss: 25,5 m³/s
- 16.08.1972 Abfluss: 20,4 m³/s
- 23.02.1970 Abfluss: 19,8 m³/s
- 26.01.1995 Abfluss: 19,7 m³/s
- 28.05.2006 Abfluss: 18,5 m³/s
| Date | Mean value [m³/s] | Maximum [m³/s] | Minimum [m³/s] |
|---|---|---|---|
| 19.02.2021 | 0.874 | 0.963 | 0.791 |
| 18.02.2021 | 1.04 | 1.49 | 0.904 |
| 17.02.2021 | 1.05 | 2.1 | 0.48 |
| 16.02.2021 | 0.458 | 0.629 | 0.434 |
| 15.02.2021 | 0.429 | 0.457 | 0.411 |
| 14.02.2021 | 0.44 | 0.654 | 0.369 |
| 13.02.2021 | 0.47 | 0.603 | 0.411 |
© Bayerisches Landesamt für Umwelt 2024