
- Start >
- Rivers >
- Discharge >
- Oberer Main - Elbe >
- Erbendorf >
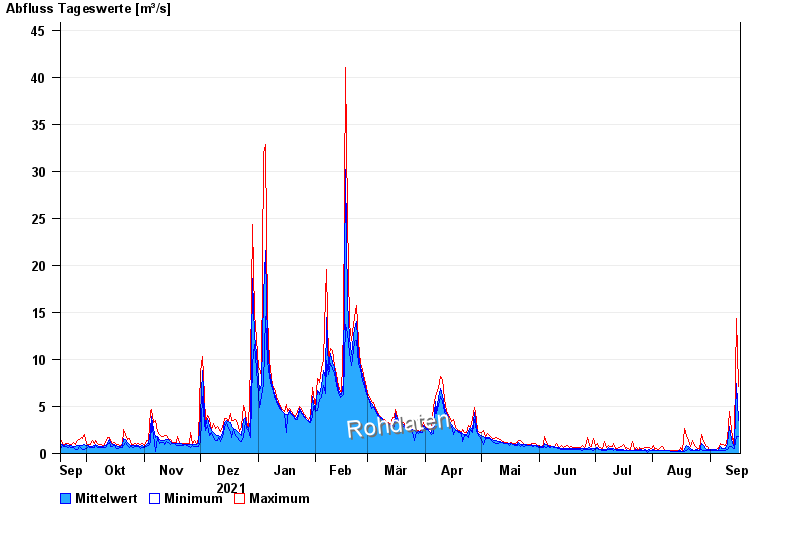
- Chart of year

Chart of year Erbendorf / Fichtelnaab
Discharge from 17.09.2021 to 16.09.2022
| Date | Mean value [m³/s] | Maximum [m³/s] | Minimum [m³/s] |
|---|---|---|---|
| 16.09.2022 | 3.52 | 7.1 | 1.81 |
| 15.09.2022 | 7.45 | 14.4 | 1.81 |
| 14.09.2022 | 0.969 | 2.15 | 0.515 |
| 13.09.2022 | 0.821 | 1.05 | 0.515 |
| 12.09.2022 | 1.52 | 2.59 | 0.706 |
| 11.09.2022 | 2.87 | 4.42 | 0.757 |
| 10.09.2022 | 1.1 | 1.64 | 0.394 |
© Bayerisches Landesamt für Umwelt 2024