
- Start >
- Rivers >
- Discharge >
- Oberer Main - Elbe >
- Erbendorf >
- Chart of year

Chart of year Erbendorf / Fichtelnaab
Discharge from 17.09.2020 to 16.09.2021
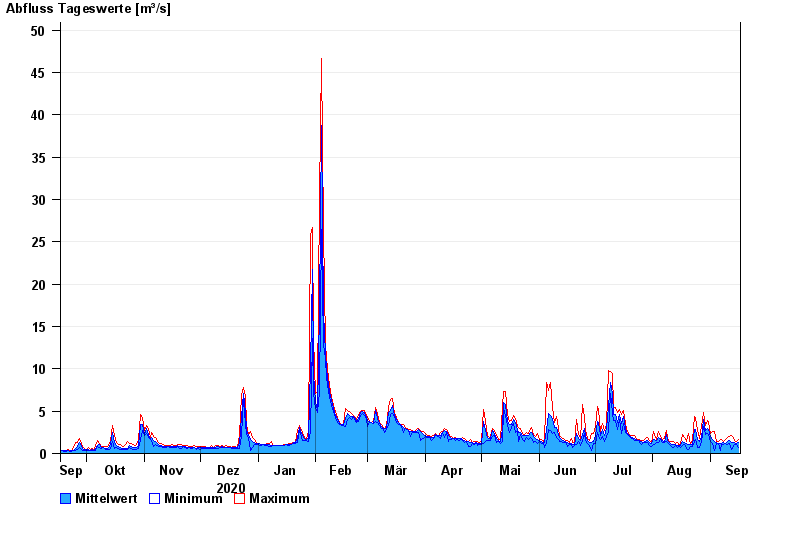
| Date | Mean value [m³/s] | Maximum [m³/s] | Minimum [m³/s] |
|---|---|---|---|
| 16.09.2021 | 1.25 | 1.67 | 0.723 |
| 15.09.2021 | 1.18 | 1.44 | 1.08 |
| 14.09.2021 | 1.29 | 1.59 | 1.08 |
| 13.09.2021 | 1.32 | 1.92 | 0.779 |
| 12.09.2021 | 1.35 | 2.09 | 0.488 |
| 11.09.2021 | 1.58 | 2.01 | 1.15 |
| 10.09.2021 | 1.37 | 1.84 | 1.02 |
© Bayerisches Landesamt für Umwelt 2024