
- Start >
- Rivers >
- Discharge >
- Oberer Main - Elbe >
- Bärenthal >
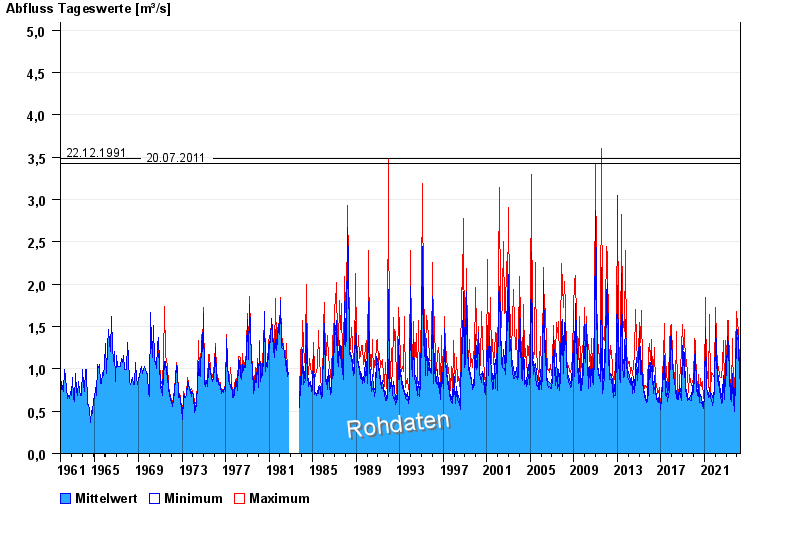
- Chart of total period

Chart of total period Bärenthal / Trubach
Discharge from 01.11.1961 to 27.04.2024
note
Absinken des Wasserstandes wegen Entfernung von Auflandungen.
- 01.03.1956 Abfluss: 12 m³/s
- 01.02.1950 Abfluss: 7,4 m³/s
- 01.03.1955 Abfluss: 5,2 m³/s
- 22.12.1991 Abfluss: 3,48 m³/s
- 20.07.2011 Abfluss: 3,42 m³/s
| Date | Mean value [m³/s] | Maximum [m³/s] | Minimum [m³/s] |
|---|---|---|---|
| 27.04.2024 | 0.89 | 0.89 | 0.89 |
| 26.04.2024 | 0.903 | 0.94 | 0.835 |
| 25.04.2024 | 0.942 | 1 | 0.89 |
| 24.04.2024 | 0.955 | 1 | 0.89 |
| 23.04.2024 | 0.959 | 1.06 | 0.89 |
| 22.04.2024 | 1 | 1.06 | 0.94 |
| 21.04.2024 | 1.03 | 1.06 | 0.89 |
© Bayerisches Landesamt für Umwelt 2024