
- Start >
- Rivers >
- Discharge >
- Oberer Main - Elbe >
- Bärenthal >
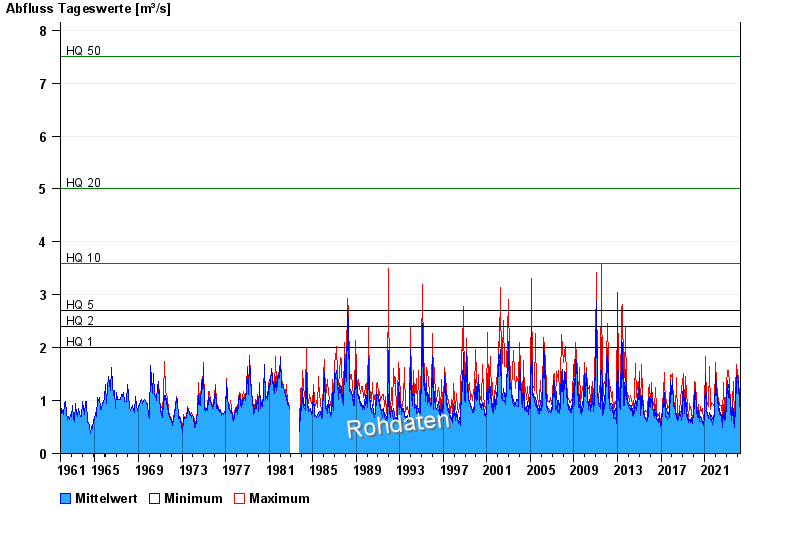
- Chart of total period

Chart of total period Bärenthal / Trubach
Discharge from 01.11.1961 to 19.04.2024
note
Absinken des Wasserstandes wegen Entfernung von Auflandungen.
- HQ1 2 m³/s
- HQ2 2,4 m³/s
- HQ5 2,7 m³/s
- HQ10 3,6 m³/s
- HQ20 5 m³/s
- HQ50 7,5 m³/s
- HQ100 10 m³/s
| Date | Mean value [m³/s] | Maximum [m³/s] | Minimum [m³/s] |
|---|---|---|---|
| 19.04.2024 | 0.835 | 0.835 | 0.835 |
| 18.04.2024 | 0.819 | 0.89 | 0.786 |
| 17.04.2024 | 0.86 | 0.94 | 0.786 |
| 16.04.2024 | 0.903 | 0.94 | 0.835 |
| 15.04.2024 | 0.822 | 0.835 | 0.786 |
| 14.04.2024 | 0.806 | 0.89 | 0.738 |
| 13.04.2024 | 0.811 | 0.89 | 0.738 |
© Bayerisches Landesamt für Umwelt 2024