

Chart of year Würzburg / Main
Discharge from 17.07.2020 to 16.07.2021
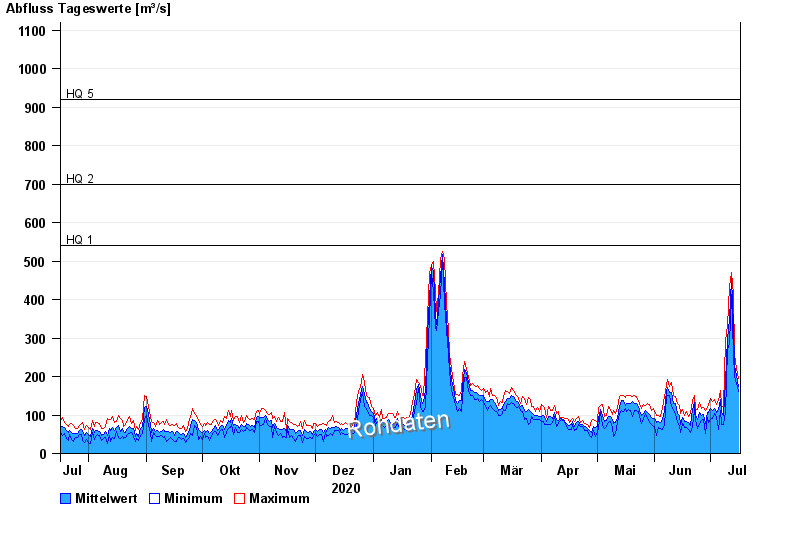
- HQ1 540 m³/s
- HQ2 700 m³/s
- HQ5 920 m³/s
- HQ10 1130 m³/s
- HQ20 1400 m³/s
- HQ50 1700 m³/s
- HQ100 2000 m³/s
| Date | Mean value [m³/s] | Maximum [m³/s] | Minimum [m³/s] |
|---|---|---|---|
| 16.07.2021 | 174 | 195 | 160 |
| 15.07.2021 | 202 | 220 | 182 |
| 14.07.2021 | 229 | 258 | 200 |
| 13.07.2021 | 332 | 413 | 258 |
| 12.07.2021 | 456 | 471 | 413 |
| 11.07.2021 | 349 | 434 | 287 |
| 10.07.2021 | 299 | 333 | 271 |
© Bayerisches Landesamt für Umwelt 2024