

Chart of year Würzburg / Main
Discharge from 17.07.2021 to 16.07.2022
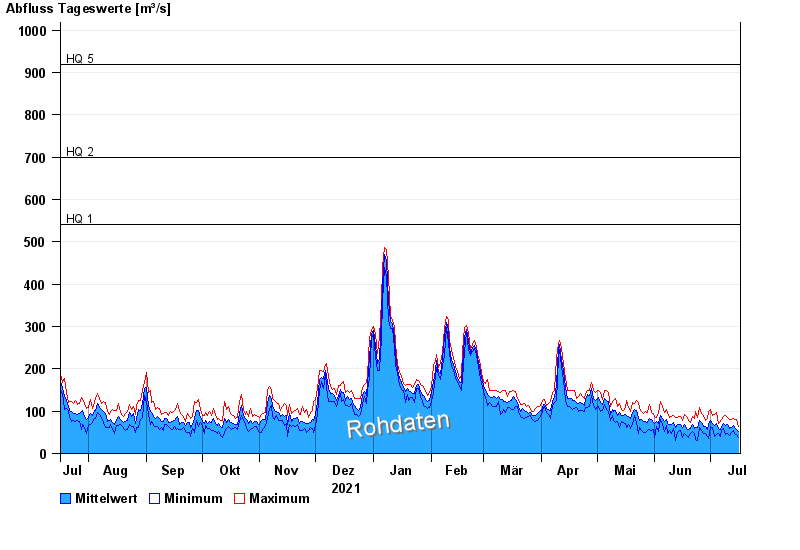
- HQ1 540 m³/s
- HQ2 700 m³/s
- HQ5 920 m³/s
- HQ10 1130 m³/s
- HQ20 1400 m³/s
- HQ50 1700 m³/s
- HQ100 2000 m³/s
| Date | Mean value [m³/s] | Maximum [m³/s] | Minimum [m³/s] |
|---|---|---|---|
| 16.07.2022 | 51.9 | 64.9 | 38.4 |
| 15.07.2022 | 57.8 | 79.3 | 44.1 |
| 14.07.2022 | 62 | 80 | 47.1 |
| 13.07.2022 | 65.4 | 82.9 | 54.7 |
| 12.07.2022 | 61.7 | 80 | 50.7 |
| 11.07.2022 | 58.8 | 81.1 | 43.2 |
| 10.07.2022 | 67.8 | 85 | 46.9 |
© Bayerisches Landesamt für Umwelt 2024