

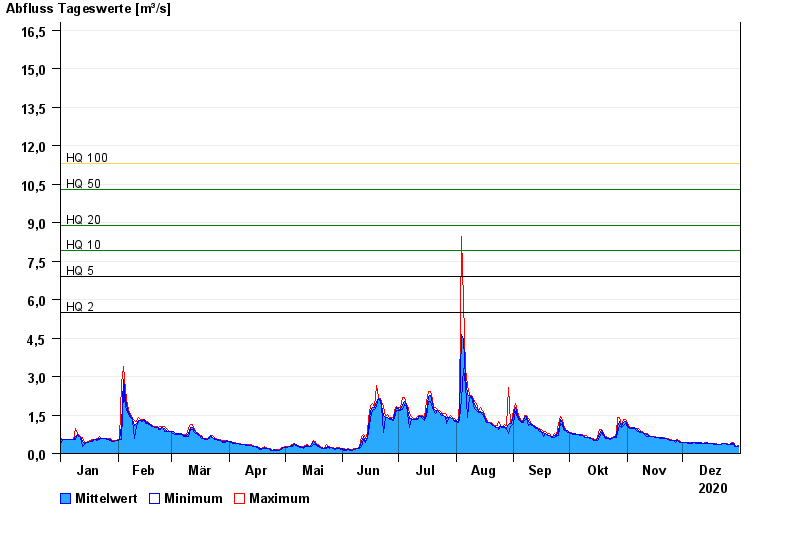
Chart of year Seeshaupt / Steinbach
Discharge from 01.01.2020 to 31.12.2020
Rückstau
Abflussberechnung wird durch Rückstau des Starnberger Sees bei HW überschätzt
- HQ2 5,5 m³/s
- HQ5 6,9 m³/s
- HQ10 7,9 m³/s
- HQ20 8,9 m³/s
- HQ50 10,3 m³/s
- HQ100 11,3 m³/s
| Date | Mean value [m³/s] | Maximum [m³/s] | Minimum [m³/s] |
|---|---|---|---|
| 31.12.2020 | 0.292 | 0.32 | 0.292 |
| 30.12.2020 | 0.291 | 0.292 | 0.291 |
| 29.12.2020 | 0.307 | 0.351 | 0.291 |
| 28.12.2020 | 0.374 | 0.418 | 0.351 |
| 27.12.2020 | 0.38 | 0.418 | 0.351 |
| 26.12.2020 | 0.348 | 0.351 | 0.345 |
| 25.12.2020 | 0.356 | 0.378 | 0.345 |
© Bayerisches Landesamt für Umwelt 2024