

Chart of year Seeshaupt / Steinbach
Discharge from 01.01.2021 to 31.12.2021
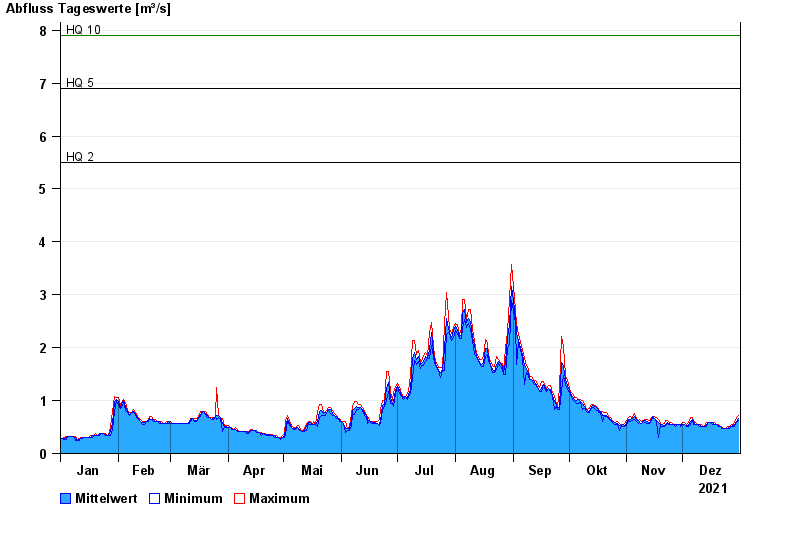
- HQ2 5,5 m³/s
- HQ5 6,9 m³/s
- HQ10 7,9 m³/s
- HQ20 8,9 m³/s
- HQ50 10,3 m³/s
- HQ100 11,3 m³/s
| Date | Mean value [m³/s] | Maximum [m³/s] | Minimum [m³/s] |
|---|---|---|---|
| 31.12.2021 | 0.67 | 0.719 | 0.629 |
| 30.12.2021 | 0.614 | 0.673 | 0.586 |
| 29.12.2021 | 0.545 | 0.586 | 0.505 |
| 28.12.2021 | 0.536 | 0.545 | 0.505 |
| 27.12.2021 | 0.508 | 0.545 | 0.505 |
| 26.12.2021 | 0.504 | 0.505 | 0.466 |
| 25.12.2021 | 0.479 | 0.505 | 0.466 |
© Bayerisches Landesamt für Umwelt 2024