

Chart of total period Schönach / Große Laber
Discharge from 01.11.1953 to 26.04.2024
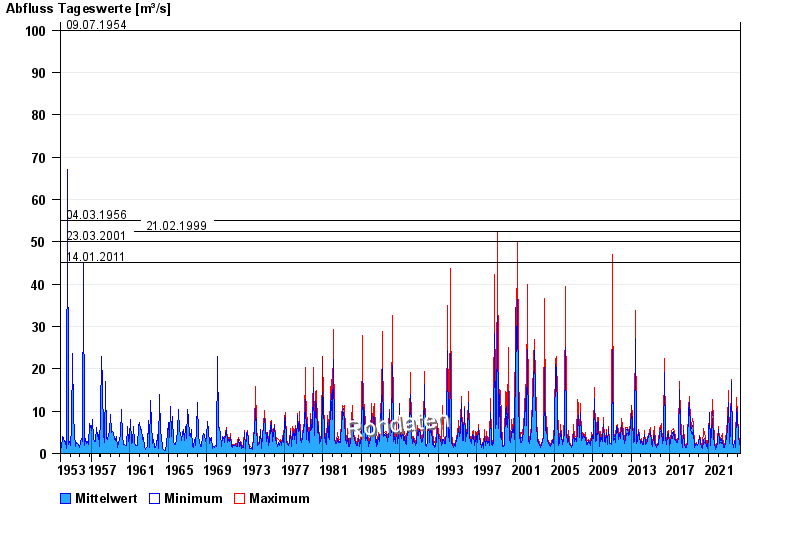
- 09.07.1954 Abfluss: 100 m³/s
- 04.03.1956 Abfluss: 55 m³/s
- 21.02.1999 Abfluss: 52,4 m³/s
- 23.03.2001 Abfluss: 50 m³/s
- 14.01.2011 Abfluss: 45,2 m³/s
| Date | Mean value [m³/s] | Maximum [m³/s] | Minimum [m³/s] |
|---|---|---|---|
| 26.04.2024 | 2.59 | 2.61 | 2.53 |
| 25.04.2024 | 2.62 | 2.68 | 2.61 |
| 24.04.2024 | 2.81 | 2.94 | 2.61 |
| 23.04.2024 | 3.19 | 3.29 | 2.94 |
| 22.04.2024 | 3.03 | 3.2 | 2.94 |
| 21.04.2024 | 2.92 | 2.94 | 2.86 |
| 20.04.2024 | 2.81 | 2.94 | 2.61 |
© Bayerisches Landesamt für Umwelt 2024