

Chart of total period Schönach / Große Laber
Discharge from 01.11.1953 to 01.05.2024
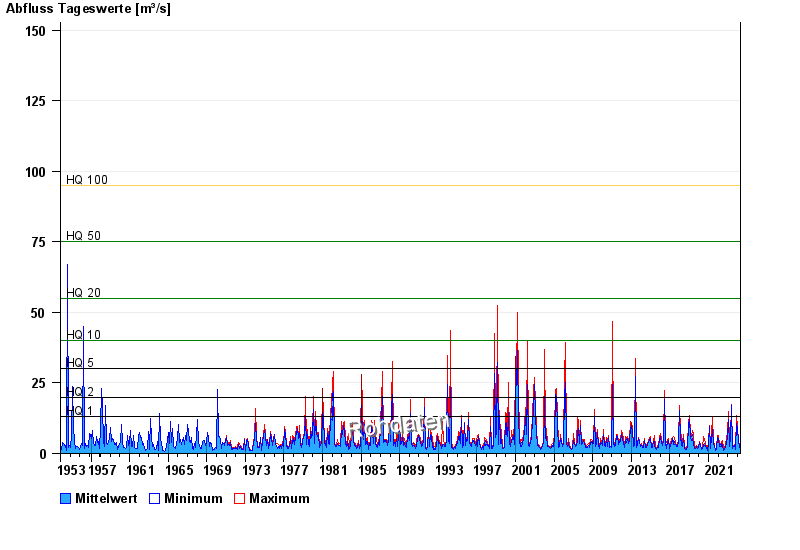
- HQ1 13 m³/s
- HQ2 20 m³/s
- HQ5 30 m³/s
- HQ10 40 m³/s
- HQ20 55 m³/s
- HQ50 75 m³/s
- HQ100 95 m³/s
| Date | Mean value [m³/s] | Maximum [m³/s] | Minimum [m³/s] |
|---|---|---|---|
| 01.05.2024 | 2.17 | 2.23 | 2.16 |
| 30.04.2024 | 2.24 | 2.3 | 2.16 |
| 29.04.2024 | 2.27 | 2.38 | 2.16 |
| 28.04.2024 | 2.37 | 2.46 | 2.3 |
| 27.04.2024 | 2.5 | 2.53 | 2.46 |
| 26.04.2024 | 2.59 | 2.61 | 2.53 |
| 25.04.2024 | 2.62 | 2.68 | 2.61 |
© Bayerisches Landesamt für Umwelt 2024