

Chart of total period Schmerold / Mangfall
Discharge from 01.11.1927 to 27.04.2024
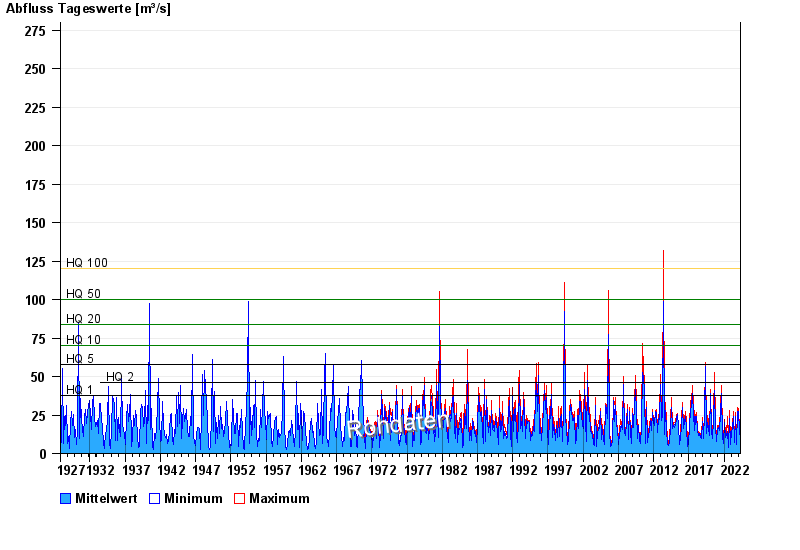
- HQ1 38 m³/s
- HQ2 46 m³/s
- HQ5 58 m³/s
- HQ10 70 m³/s
- HQ20 84 m³/s
- HQ50 100 m³/s
- HQ100 120 m³/s
| Date | Mean value [m³/s] | Maximum [m³/s] | Minimum [m³/s] |
|---|---|---|---|
| 27.04.2024 | 8.3 | 8.61 | 8.03 |
| 26.04.2024 | 8.43 | 8.91 | 7.73 |
| 25.04.2024 | 8.95 | 9.5 | 8.61 |
| 24.04.2024 | 9.45 | 9.8 | 9.2 |
| 23.04.2024 | 9.88 | 10.4 | 9.5 |
| 22.04.2024 | 10.1 | 10.7 | 9.8 |
| 21.04.2024 | 9.45 | 10.7 | 8.32 |
© Bayerisches Landesamt für Umwelt 2024