

Chart of total period Schmerold / Mangfall
Discharge from 01.11.1927 to 19.04.2024
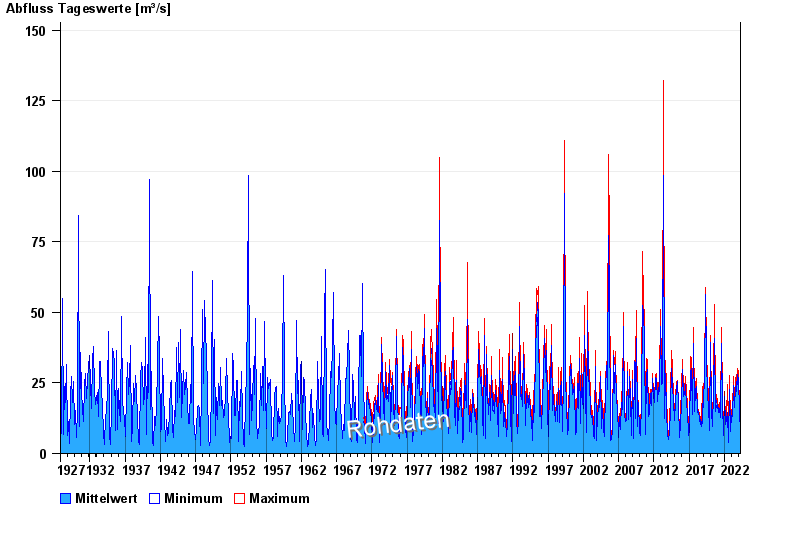
| Date | Mean value [m³/s] | Maximum [m³/s] | Minimum [m³/s] |
|---|---|---|---|
| 19.04.2024 | 7.13 | 8.32 | 6.59 |
| 18.04.2024 | 6.71 | 7.16 | 6.33 |
| 17.04.2024 | 5.62 | 7.44 | 4.36 |
| 16.04.2024 | 4.72 | 5.05 | 4.36 |
| 15.04.2024 | 4.87 | 7.16 | 3.15 |
| 14.04.2024 | 5.33 | 6.59 | 2.8 |
| 13.04.2024 | 5.71 | 6.05 | 5.29 |
© Bayerisches Landesamt für Umwelt 2024