
- Start >
- Rivers >
- Discharge >
- Bayern >
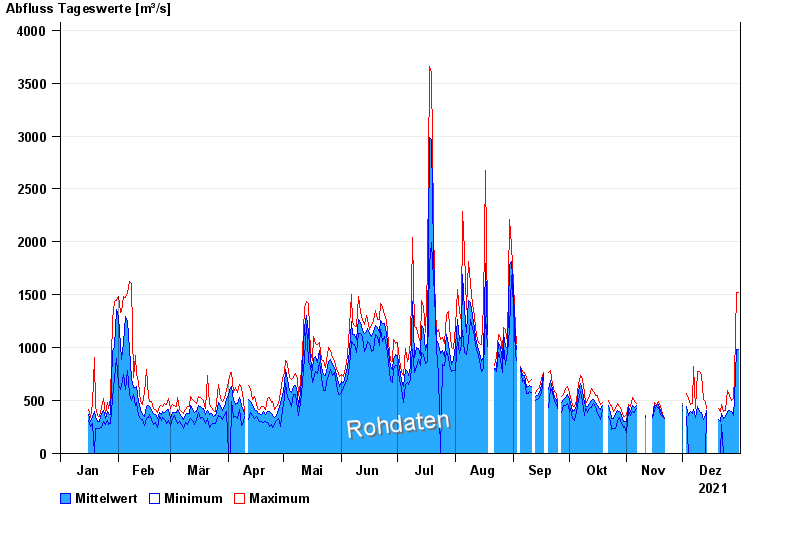
- Passau Marienbrücke Q >
- Chart of year

Chart of year Passau Marienbrücke Q / Inn
Discharge from 01.01.2021 to 31.12.2021
 Für diesen Pegel sind keine Hauptwerte hinterlegt.
| Date | Mean value [m³/s] | Maximum [m³/s] | Minimum [m³/s] |
|---|---|---|---|
| 31.12.2021 | 984 | 1520 | -- |
| 30.12.2021 | 985 | 1520 | -- |
| 29.12.2021 | 514 | 726 | -- |
| 28.12.2021 | 362 | 517 | -- |
| 27.12.2021 | 395 | 498 | -- |
| 26.12.2021 | 402 | 547 | -- |
| 25.12.2021 | 394 | 596 | -- |
© Bayerisches Landesamt für Umwelt 2025