
- Startseite >
- Flüsse >
- Abfluss >
- Bayern >
- Passau Marienbrücke Q >
- Jahresgrafik

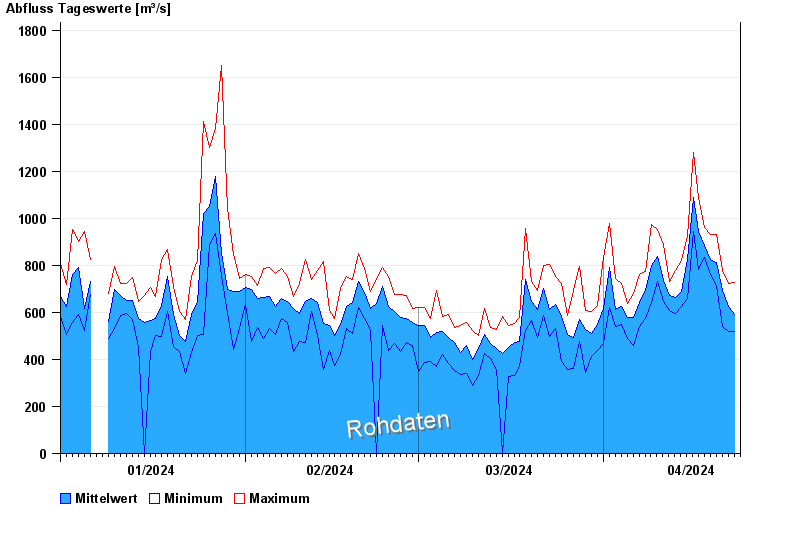
Jahresgrafik Passau Marienbrücke Q / Inn
Abfluss vom 01.01.2024 bis zum 23.04.2024
 Für diesen Pegel sind keine Hauptwerte hinterlegt.
| Datum | Mittelwert [m³/s] | Maximum [m³/s] | Minimum [m³/s] |
|---|---|---|---|
| 23.04.2024 | 590 | 728 | 518 |
| 22.04.2024 | 624 | 723 | 518 |
| 21.04.2024 | 694 | 777 | 541 |
| 20.04.2024 | 812 | 930 | 715 |
| 19.04.2024 | 824 | 931 | 760 |
| 18.04.2024 | 886 | 960 | 832 |
| 17.04.2024 | 945 | 1090 | 781 |
© Bayerisches Landesamt für Umwelt 2024