

Chart of total period Oberndorf / Donau
Discharge from 01.11.1925 to 26.04.2024
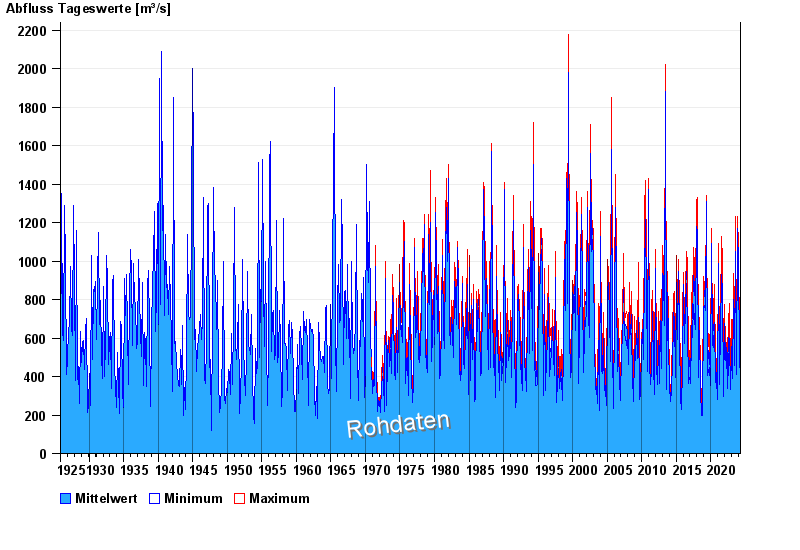
| Date | Mean value [m³/s] | Maximum [m³/s] | Minimum [m³/s] |
|---|---|---|---|
| 26.04.2024 | 323 | 330 | 309 |
| 25.04.2024 | 311 | 327 | 291 |
| 24.04.2024 | 321 | 336 | 306 |
| 23.04.2024 | 364 | 387 | 333 |
| 22.04.2024 | 390 | 399 | 378 |
| 21.04.2024 | 401 | 427 | 372 |
| 20.04.2024 | 390 | 402 | 372 |
© Bayerisches Landesamt für Umwelt 2024