

Chart of total period Oberndorf / Donau
Discharge from 01.11.1925 to 23.04.2024
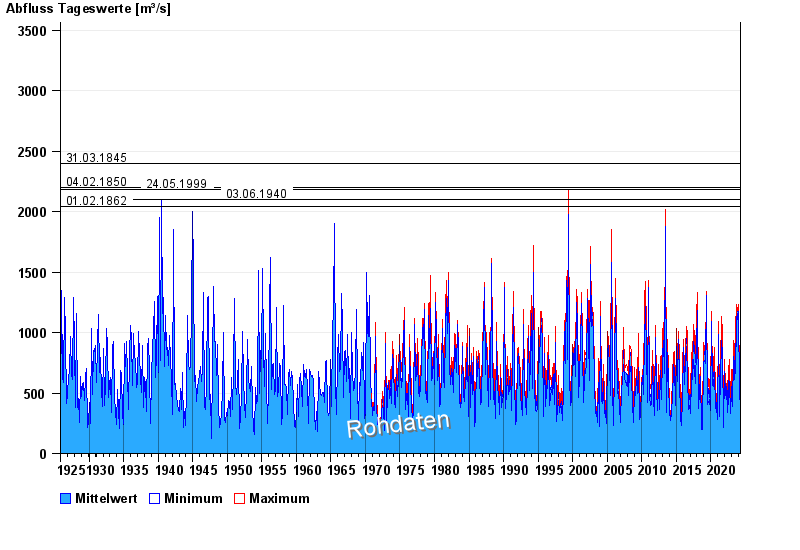
- 31.03.1845 Abfluss: 2400 m³/s
- 04.02.1850 Abfluss: 2200 m³/s
- 24.05.1999 Abfluss: 2180 m³/s
- 03.06.1940 Abfluss: 2100 m³/s
- 01.02.1862 Abfluss: 2040 m³/s
| Date | Mean value [m³/s] | Maximum [m³/s] | Minimum [m³/s] |
|---|---|---|---|
| 23.04.2024 | 377 | 387 | 362 |
| 22.04.2024 | 390 | 399 | 378 |
| 21.04.2024 | 401 | 427 | 372 |
| 20.04.2024 | 390 | 402 | 372 |
| 19.04.2024 | 396 | 412 | 381 |
| 18.04.2024 | 400 | 424 | 369 |
| 17.04.2024 | 388 | 396 | 375 |
© Bayerisches Landesamt für Umwelt 2024