
- Start >
- Rivers >
- Discharge >
- Bayern >
- Obermühlhausen >
- Chart of year

Chart of year Obermühlhausen / Windach
Discharge from 01.01.2023 to 31.12.2023
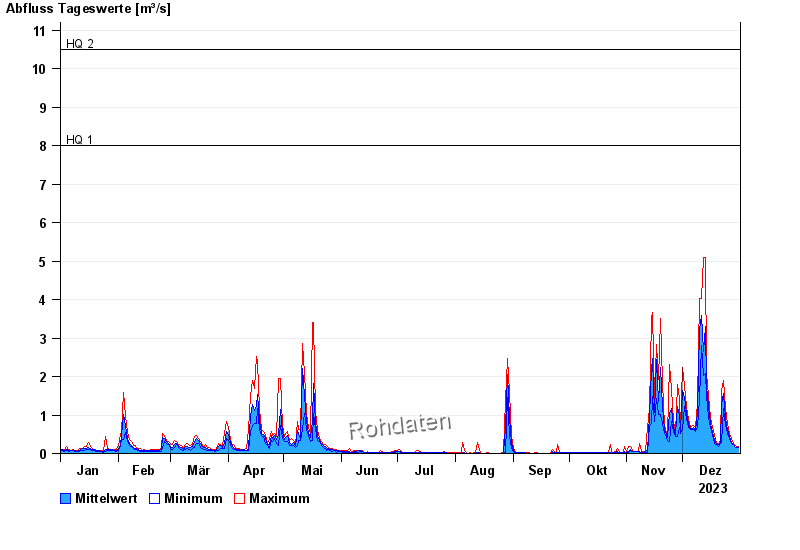
- HQ1 8 m³/s
- HQ2 10,5 m³/s
- HQ5 14 m³/s
- HQ10 17 m³/s
- HQ20 20 m³/s
- HQ50 24 m³/s
- HQ100 27 m³/s
| Date | Mean value [m³/s] | Maximum [m³/s] | Minimum [m³/s] |
|---|---|---|---|
| 31.12.2023 | 0.159 | 0.186 | 0.154 |
| 30.12.2023 | 0.165 | 0.186 | 0.154 |
| 29.12.2023 | 0.191 | 0.221 | 0.186 |
| 28.12.2023 | 0.231 | 0.257 | 0.221 |
| 27.12.2023 | 0.297 | 0.381 | 0.257 |
| 26.12.2023 | 0.439 | 0.517 | 0.381 |
| 25.12.2023 | 0.632 | 0.768 | 0.517 |
© Bayerisches Landesamt für Umwelt 2024