
- Start >
- Rivers >
- Discharge >
- Bayern >
- Obermühlhausen >
- Chart of year

Chart of year Obermühlhausen / Windach
Discharge from 01.01.2022 to 31.12.2022
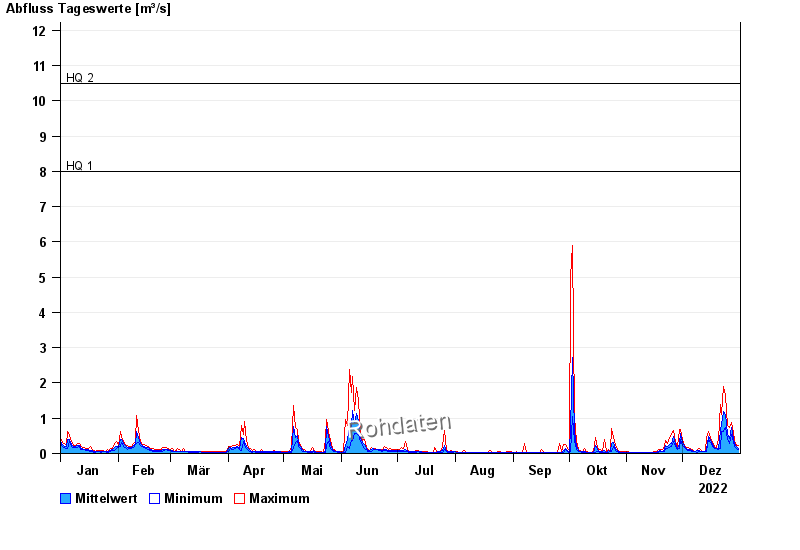
- HQ1 8 m³/s
- HQ2 10,5 m³/s
- HQ5 14 m³/s
- HQ10 17 m³/s
- HQ20 20 m³/s
- HQ50 24 m³/s
- HQ100 27 m³/s
| Date | Mean value [m³/s] | Maximum [m³/s] | Minimum [m³/s] |
|---|---|---|---|
| 31.12.2022 | 0.149 | 0.238 | 0.113 |
| 30.12.2022 | 0.186 | 0.238 | 0.141 |
| 29.12.2022 | 0.285 | 0.355 | 0.203 |
| 28.12.2022 | 0.433 | 0.582 | 0.314 |
| 27.12.2022 | 0.73 | 0.887 | 0.534 |
| 26.12.2022 | 0.42 | 0.731 | 0.275 |
| 25.12.2022 | 0.565 | 0.783 | 0.398 |
© Bayerisches Landesamt für Umwelt 2024