

Chart of total period Kötzting / Weißer Regen
Discharge from 01.11.1947 to 01.05.2024
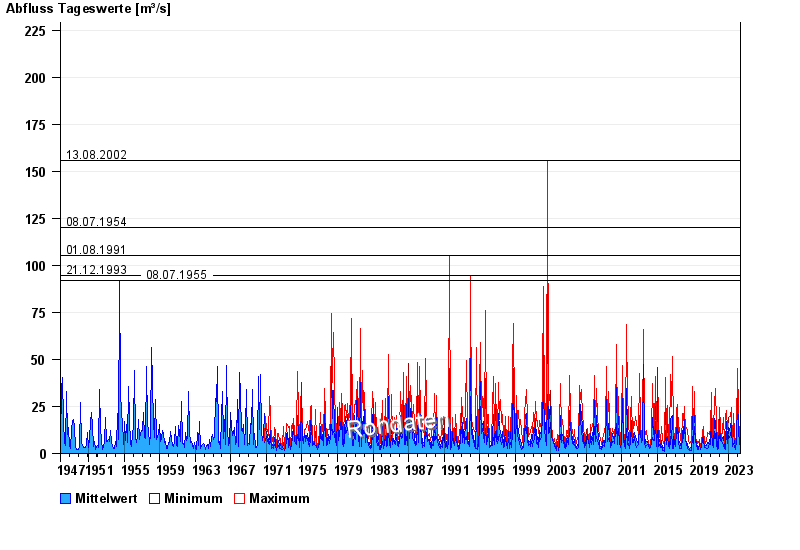
- 13.08.2002 Abfluss: 156 m³/s
- 08.07.1954 Abfluss: 120 m³/s
- 01.08.1991 Abfluss: 105 m³/s
- 21.12.1993 Abfluss: 94,5 m³/s
- 08.07.1955 Abfluss: 92,2 m³/s
| Date | Mean value [m³/s] | Maximum [m³/s] | Minimum [m³/s] |
|---|---|---|---|
| 01.05.2024 | 3.23 | 3.28 | 2.99 |
| 30.04.2024 | 3.32 | 4.07 | 2.33 |
| 29.04.2024 | 3.28 | 3.74 | 2.85 |
| 28.04.2024 | 2.94 | 3.13 | 2.71 |
| 27.04.2024 | 2.83 | 3.43 | 2.21 |
| 26.04.2024 | 2.91 | 3.28 | 2.71 |
| 25.04.2024 | 3.07 | 3.28 | 2.85 |
© Bayerisches Landesamt für Umwelt 2024