

Chart of total period Kötzting / Weißer Regen
Discharge from 01.11.1947 to 01.05.2024
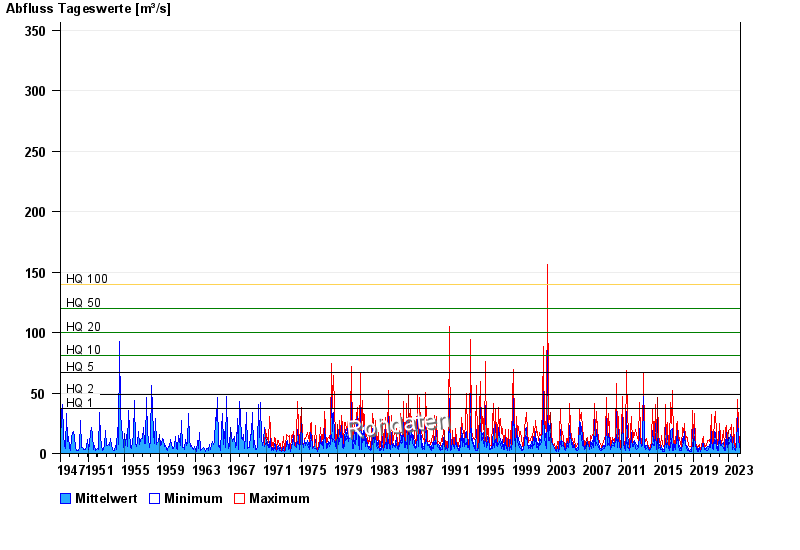
- HQ1 37 m³/s
- HQ2 49 m³/s
- HQ5 67 m³/s
- HQ10 81 m³/s
- HQ20 100 m³/s
- HQ50 120 m³/s
- HQ100 140 m³/s
| Date | Mean value [m³/s] | Maximum [m³/s] | Minimum [m³/s] |
|---|---|---|---|
| 01.05.2024 | 3.2 | 3.28 | 2.99 |
| 30.04.2024 | 3.32 | 4.07 | 2.33 |
| 29.04.2024 | 3.28 | 3.74 | 2.85 |
| 28.04.2024 | 2.94 | 3.13 | 2.71 |
| 27.04.2024 | 2.83 | 3.43 | 2.21 |
| 26.04.2024 | 2.91 | 3.28 | 2.71 |
| 25.04.2024 | 3.07 | 3.28 | 2.85 |
© Bayerisches Landesamt für Umwelt 2024