

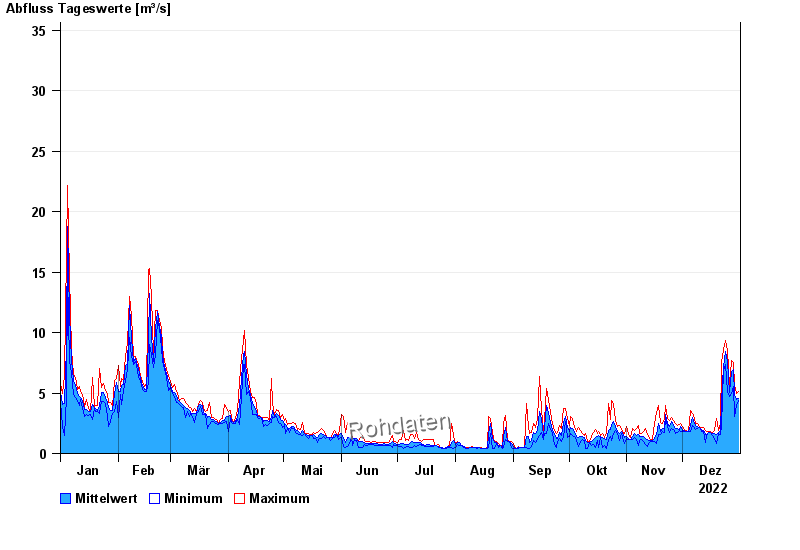
Chart of year Hohenberg / Eger
Discharge from 01.01.2022 to 31.12.2022
- 28.05.2006 Abfluss: 63 m³/s
- 14.01.2011 Abfluss: 57,1 m³/s
- 13.02.2005 Abfluss: 55,1 m³/s
- 01.11.1998 Abfluss: 52,9 m³/s
- 06.01.1982 Abfluss: 49,9 m³/s
| Date | Mean value [m³/s] | Maximum [m³/s] | Minimum [m³/s] |
|---|---|---|---|
| 31.12.2022 | 4.33 | 4.92 | 4.16 |
| 30.12.2022 | 4.31 | 4.7 | 3.75 |
| 29.12.2022 | 4.64 | 5.39 | 2.9 |
| 28.12.2022 | 6.73 | 7.38 | 5.27 |
| 27.12.2022 | 6.64 | 7.39 | 4.82 |
| 26.12.2022 | 4.87 | 5.27 | 4.6 |
| 25.12.2022 | 7.41 | 8.35 | 4.82 |
© Bayerisches Landesamt für Umwelt 2024