

Chart of year Hohenberg / Eger
Discharge from 01.01.2022 to 31.12.2022
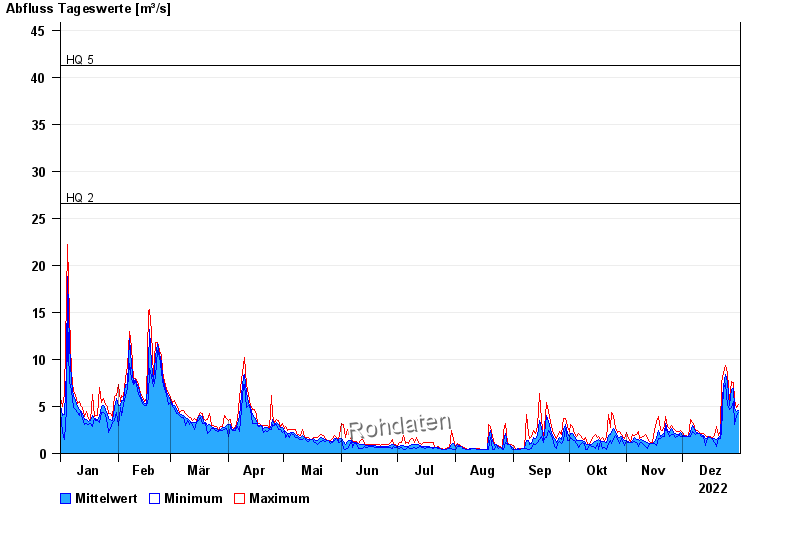
- HQ2 26,6 m³/s
- HQ5 41,3 m³/s
- HQ10 54,6 m³/s
- HQ20 69,4 m³/s
- HQ50 91,5 m³/s
- HQ100 112 m³/s
| Date | Mean value [m³/s] | Maximum [m³/s] | Minimum [m³/s] |
|---|---|---|---|
| 31.12.2022 | 4.33 | 4.92 | 4.16 |
| 30.12.2022 | 4.31 | 4.7 | 3.75 |
| 29.12.2022 | 4.64 | 5.39 | 2.9 |
| 28.12.2022 | 6.73 | 7.38 | 5.27 |
| 27.12.2022 | 6.64 | 7.39 | 4.82 |
| 26.12.2022 | 4.87 | 5.27 | 4.6 |
| 25.12.2022 | 7.41 | 8.35 | 4.82 |
© Bayerisches Landesamt für Umwelt 2025