

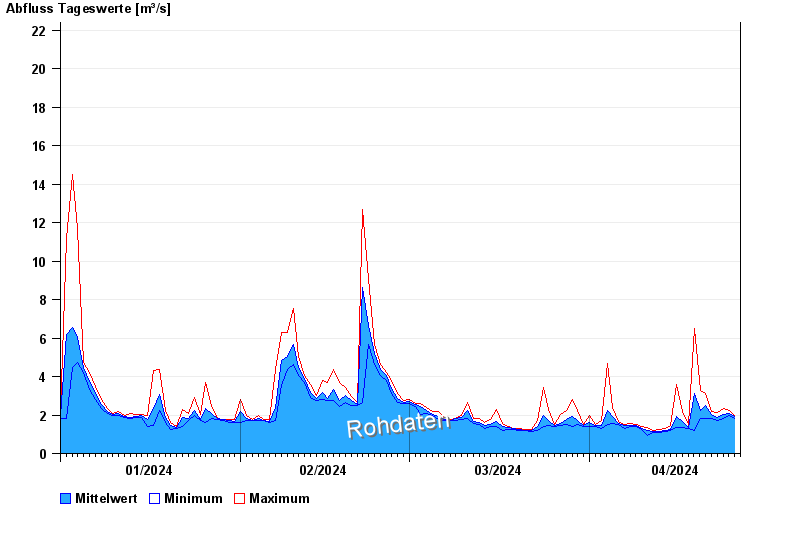
Chart of year Goldbach / Aschaff
Discharge from 01.01.2024 to 26.04.2024
- 10.08.1981 Abfluss: 65,6 m³/s
- 09.06.1965 Abfluss: 55,1 m³/s
- 02.06.1961 Abfluss: 44,1 m³/s
- 28.10.1998 Abfluss: 42,7 m³/s
- 26.01.1995 Abfluss: 35,2 m³/s
| Date | Mean value [m³/s] | Maximum [m³/s] | Minimum [m³/s] |
|---|---|---|---|
| 26.04.2024 | 1.83 | 1.9 | 1.77 |
| 25.04.2024 | 1.98 | 2.16 | 1.9 |
| 24.04.2024 | 1.93 | 2.23 | 1.71 |
| 23.04.2024 | 1.78 | 2.03 | 1.64 |
| 22.04.2024 | 1.94 | 2.09 | 1.71 |
| 21.04.2024 | 2.5 | 3.1 | 1.83 |
| 20.04.2024 | 2.24 | 3.25 | 1.83 |
© Bayerisches Landesamt für Umwelt 2024