

Chart of year Goldbach / Aschaff
Discharge from 01.01.2024 to 18.04.2024
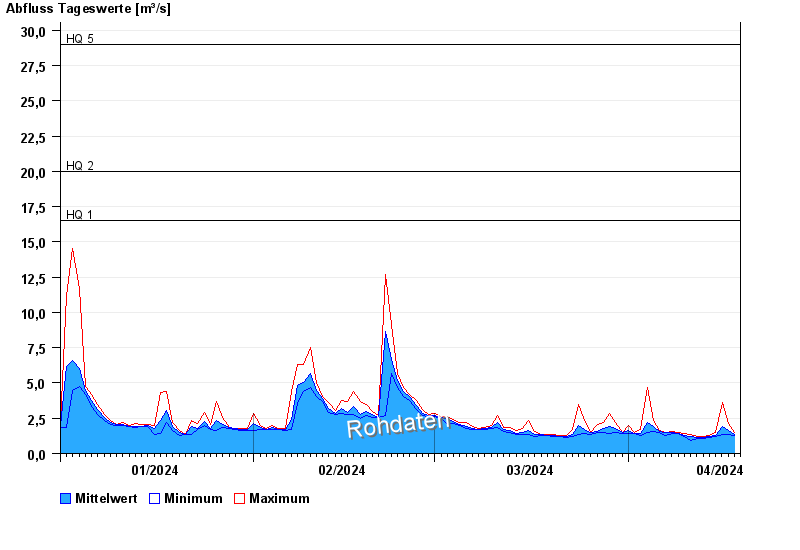
- HQ1 16,5 m³/s
- HQ2 20 m³/s
- HQ5 29 m³/s
- HQ10 36 m³/s
- HQ20 45 m³/s
- HQ50 60 m³/s
- HQ100 72 m³/s
| Date | Mean value [m³/s] | Maximum [m³/s] | Minimum [m³/s] |
|---|---|---|---|
| 18.04.2024 | 1.36 | 1.52 | 1.29 |
| 17.04.2024 | 1.66 | 2.16 | 1.35 |
| 16.04.2024 | 1.93 | 3.58 | 1.35 |
| 15.04.2024 | 1.26 | 1.46 | 1.18 |
| 14.04.2024 | 1.19 | 1.29 | 1.13 |
| 13.04.2024 | 1.16 | 1.23 | 1.08 |
| 12.04.2024 | 1.15 | 1.18 | 1.08 |
© Bayerisches Landesamt für Umwelt 2024