
- Start >
- Rivers >
- Discharge >
- Bayern >
- Gampelmühle >
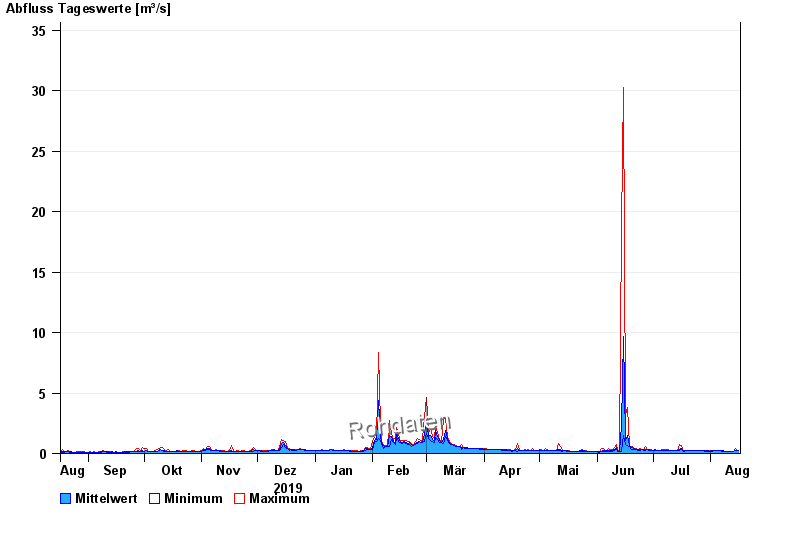
- Chart of year

Chart of year Gampelmühle / Ölschnitz
Discharge from 17.08.2019 to 16.08.2020
| Date | Mean value [m³/s] | Maximum [m³/s] | Minimum [m³/s] |
|---|---|---|---|
| 16.08.2020 | 0.235 | 0.25 | 0.219 |
| 15.08.2020 | 0.276 | 0.301 | 0.25 |
| 14.08.2020 | 0.282 | 0.381 | 0.25 |
| 13.08.2020 | 0.188 | 0.205 | 0.179 |
| 12.08.2020 | 0.197 | 0.205 | 0.192 |
| 11.08.2020 | 0.19 | 0.205 | 0.179 |
| 10.08.2020 | 0.194 | 0.205 | 0.192 |
© Bayerisches Landesamt für Umwelt 2024