
- Start >
- Rivers >
- Discharge >
- Bayern >
- Gampelmühle >
- Chart of year

Chart of year Gampelmühle / Ölschnitz
Discharge from 17.08.2018 to 16.08.2019
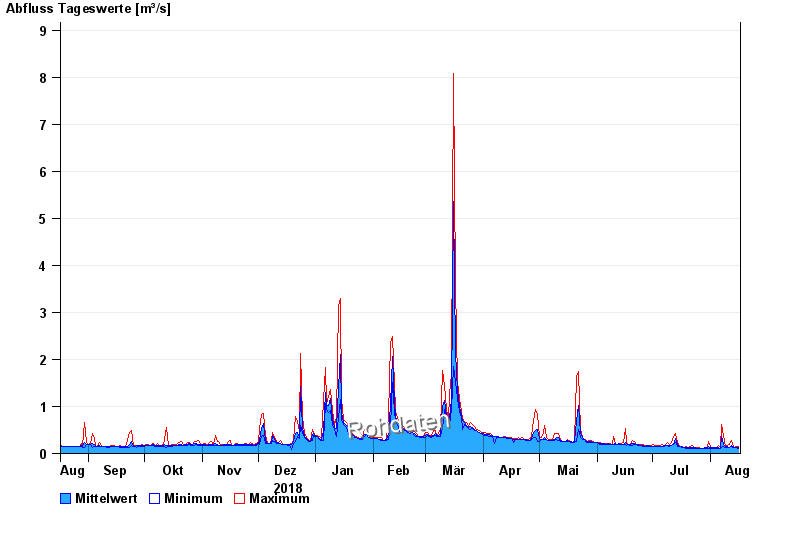
| Date | Mean value [m³/s] | Maximum [m³/s] | Minimum [m³/s] |
|---|---|---|---|
| 16.08.2019 | 0.136 | 0.143 | 0.107 |
| 15.08.2019 | 0.131 | 0.143 | 0.124 |
| 14.08.2019 | 0.131 | 0.133 | 0.124 |
| 13.08.2019 | 0.139 | 0.153 | 0.124 |
| 12.08.2019 | 0.175 | 0.278 | 0.153 |
| 11.08.2019 | 0.137 | 0.201 | 0.133 |
| 10.08.2019 | 0.151 | 0.164 | 0.133 |
© Bayerisches Landesamt für Umwelt 2024