
- Start >
- Rivers >
- Discharge >
- Bayern >
- Förmitz Speicherzufluss >
- Chart of year

Chart of year Förmitz Speicherzufluss / Förmitz
Discharge from 01.01.2024 to 31.12.2024
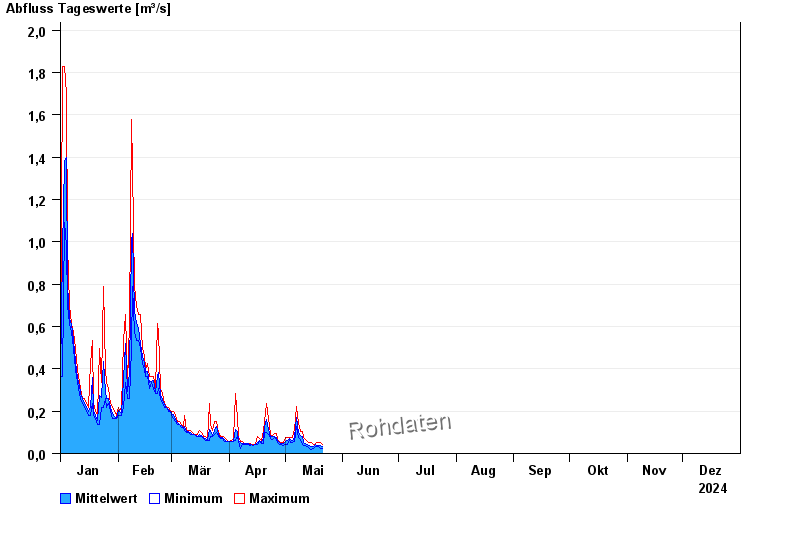
| Date | Mean value [m³/s] | Maximum [m³/s] | Minimum [m³/s] |
|---|---|---|---|
| 29.05.2024 | 0.063 | 0.083 | 0.044 |
| 28.05.2024 | 0.072 | 0.093 | 0.044 |
| 27.05.2024 | 0.05 | 0.066 | 0.037 |
| 26.05.2024 | 0.073 | 0.103 | 0.051 |
| 25.05.2024 | 0.076 | 0.115 | 0.051 |
| 24.05.2024 | 0.066 | 0.075 | 0.058 |
| 23.05.2024 | 0.096 | 0.155 | 0.066 |
© Bayerisches Landesamt für Umwelt 2024