
- Start >
- Rivers >
- Discharge >
- Bayern >
- Förmitz Speicherzufluss >
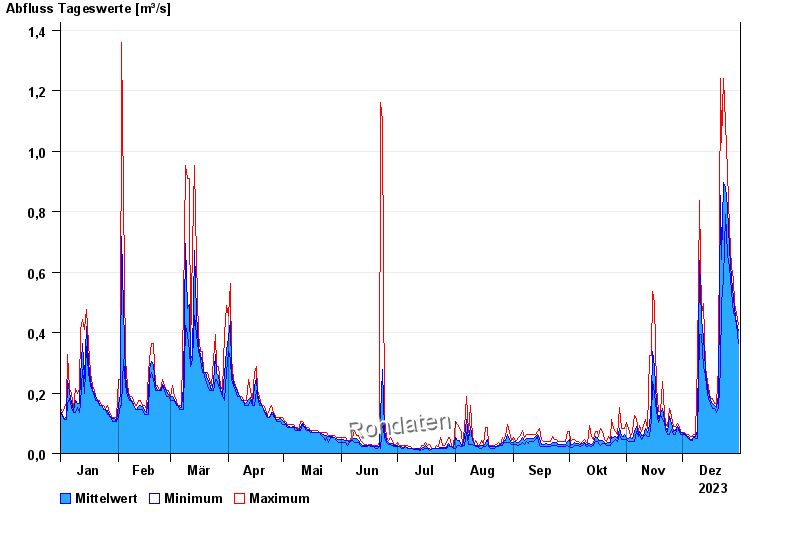
- Chart of year

Chart of year Förmitz Speicherzufluss / Förmitz
Discharge from 01.01.2023 to 31.12.2023
| Date | Mean value [m³/s] | Maximum [m³/s] | Minimum [m³/s] |
|---|---|---|---|
| 31.12.2023 | 0.319 | 0.348 | 0.297 |
| 30.12.2023 | 0.349 | 0.376 | 0.322 |
| 29.12.2023 | 0.391 | 0.406 | 0.348 |
| 28.12.2023 | 0.423 | 0.469 | 0.406 |
| 27.12.2023 | 0.472 | 0.504 | 0.437 |
| 26.12.2023 | 0.573 | 0.616 | 0.504 |
| 25.12.2023 | 0.714 | 0.887 | 0.577 |
© Bayerisches Landesamt für Umwelt 2025