
- Start >
- Rivers >
- Discharge >
- Bayern >
- Eggenfelden >
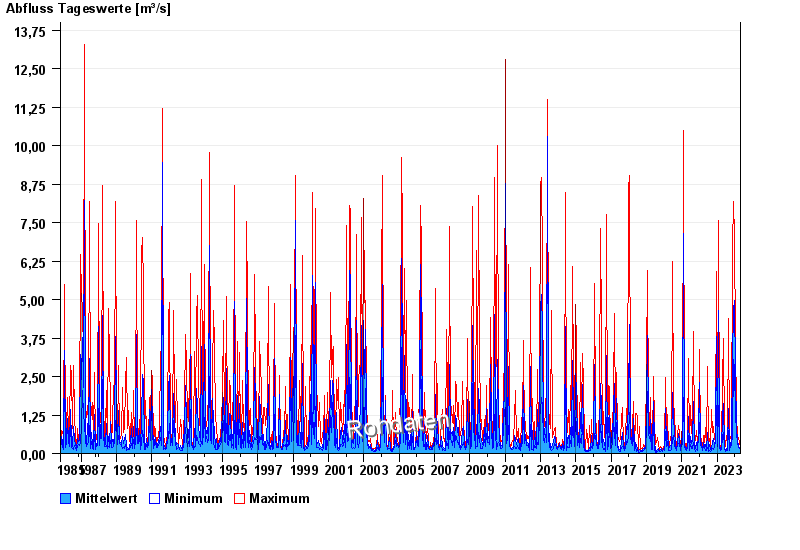
- Chart of total period

Chart of total period Eggenfelden / Mertseebach
Discharge from 01.11.1985 to 26.04.2024
| Date | Mean value [m³/s] | Maximum [m³/s] | Minimum [m³/s] |
|---|---|---|---|
| 26.04.2024 | 0.15 | 0.174 | 0.145 |
| 25.04.2024 | 0.153 | 0.174 | 0.145 |
| 24.04.2024 | 0.146 | 0.174 | 0.145 |
| 23.04.2024 | 0.145 | 0.145 | 0.145 |
| 22.04.2024 | 0.174 | 0.205 | 0.145 |
| 21.04.2024 | 0.156 | 0.205 | 0.145 |
| 20.04.2024 | 0.167 | 0.205 | 0.145 |
© Bayerisches Landesamt für Umwelt 2024