
- Start >
- Rivers >
- Discharge >
- Bayern >
- Eggenfelden >
- Chart of total period

Chart of total period Eggenfelden / Mertseebach
Discharge from 01.11.1985 to 19.04.2024
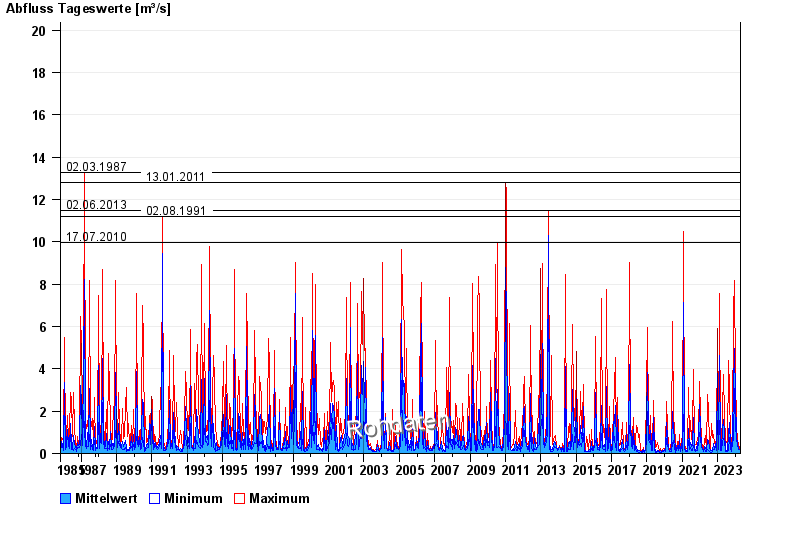
- 02.03.1987 Abfluss: 13,3 m³/s
- 13.01.2011 Abfluss: 12,8 m³/s
- 02.06.2013 Abfluss: 11,5 m³/s
- 02.08.1991 Abfluss: 11,2 m³/s
- 17.07.2010 Abfluss: 9,99 m³/s
| Date | Mean value [m³/s] | Maximum [m³/s] | Minimum [m³/s] |
|---|---|---|---|
| 19.04.2024 | 0.145 | 0.145 | 0.145 |
| 18.04.2024 | 0.151 | 0.174 | 0.145 |
| 17.04.2024 | 0.165 | 0.205 | 0.145 |
| 16.04.2024 | 0.147 | 0.205 | 0.12 |
| 15.04.2024 | 0.163 | 0.321 | 0.12 |
| 14.04.2024 | 0.12 | 0.12 | 0.12 |
| 13.04.2024 | 0.12 | 0.12 | 0.12 |
© Bayerisches Landesamt für Umwelt 2024