

Chart of total period Deuerling / Schwarze Laber
Discharge from 01.11.1954 to 29.04.2024
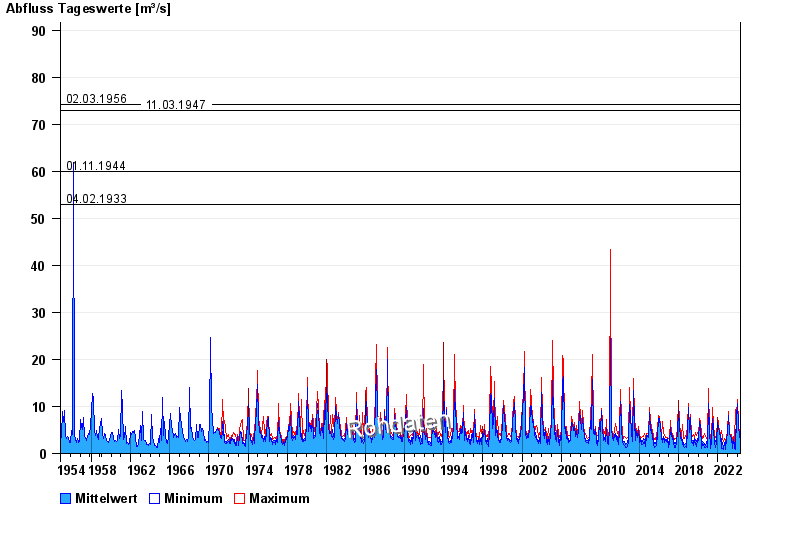
- 05.02.1909 Abfluss: 150 m³/s
- 02.03.1956 Abfluss: 74,1 m³/s
- 11.03.1947 Abfluss: 73 m³/s
- 01.11.1944 Abfluss: 60 m³/s
- 04.02.1933 Abfluss: 53 m³/s
| Date | Mean value [m³/s] | Maximum [m³/s] | Minimum [m³/s] |
|---|---|---|---|
| 29.04.2024 | 2.97 | 2.98 | 2.89 |
| 28.04.2024 | 3.05 | 3.18 | 2.89 |
| 27.04.2024 | 3.22 | 3.39 | 3.08 |
| 26.04.2024 | 3.4 | 3.6 | 3.28 |
| 25.04.2024 | 3.53 | 3.81 | 3.39 |
| 24.04.2024 | 3.67 | 3.81 | 3.6 |
| 23.04.2024 | 3.87 | 4.02 | 3.7 |
© Bayerisches Landesamt für Umwelt 2024