

Chart of total period Deuerling / Schwarze Laber
Discharge from 01.11.1954 to 29.04.2024
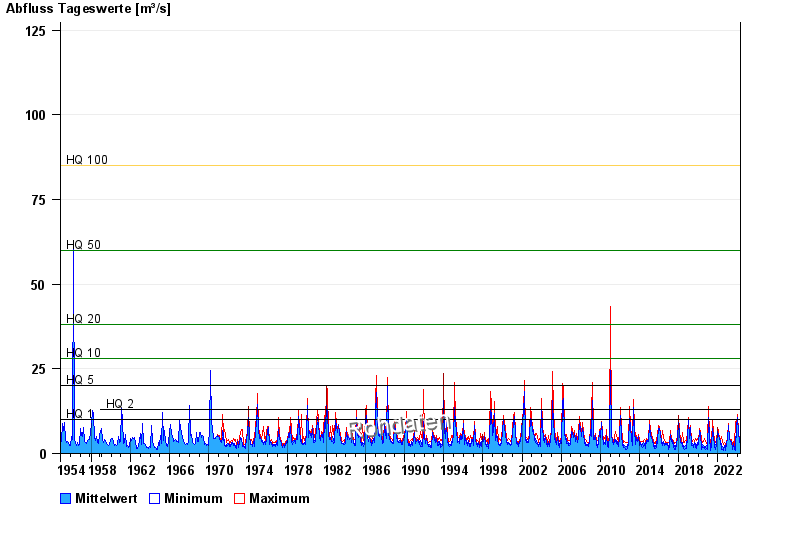
- HQ1 10 m³/s
- HQ2 13 m³/s
- HQ5 20 m³/s
- HQ10 28 m³/s
- HQ20 38 m³/s
- HQ50 60 m³/s
- HQ100 85 m³/s
| Date | Mean value [m³/s] | Maximum [m³/s] | Minimum [m³/s] |
|---|---|---|---|
| 29.04.2024 | 2.95 | 2.98 | 2.69 |
| 28.04.2024 | 3.05 | 3.18 | 2.89 |
| 27.04.2024 | 3.22 | 3.39 | 3.08 |
| 26.04.2024 | 3.4 | 3.6 | 3.28 |
| 25.04.2024 | 3.53 | 3.81 | 3.39 |
| 24.04.2024 | 3.67 | 3.81 | 3.6 |
| 23.04.2024 | 3.87 | 4.02 | 3.7 |
© Bayerisches Landesamt für Umwelt 2024