
- Start >
- Rivers >
- Discharge >
- Bayern >
- Bad Wiessee >
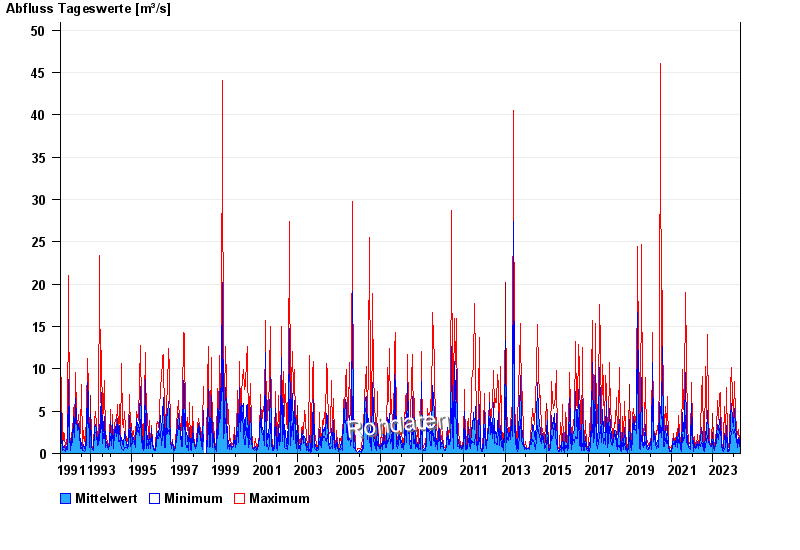
- Chart of total period

Chart of total period Bad Wiessee / Söllbach
Discharge from 01.08.1991 to 01.05.2024
| Date | Mean value [m³/s] | Maximum [m³/s] | Minimum [m³/s] |
|---|---|---|---|
| 01.05.2024 | 2.26 | 2.26 | 2.26 |
| 30.04.2024 | 2.45 | 3.08 | 1.97 |
| 29.04.2024 | 2.35 | 3.08 | 1.71 |
| 28.04.2024 | 2 | 2.91 | 1.34 |
| 27.04.2024 | 1.19 | 1.84 | 0.767 |
| 26.04.2024 | 0.668 | 1.03 | 0.552 |
| 25.04.2024 | 0.546 | 0.618 | 0.49 |
© Bayerisches Landesamt für Umwelt 2024