
- Start >
- Meteorology >
- Global radiation >
- Untere Donau >
- Pösing >
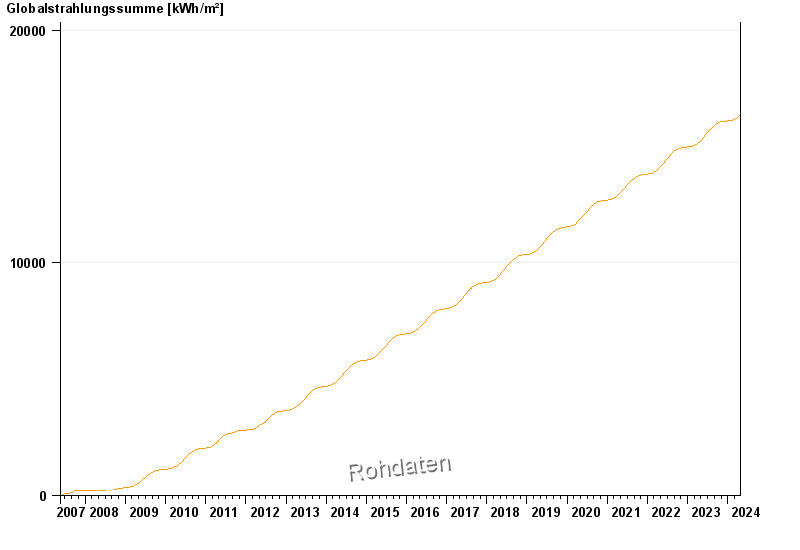
- Chart of total period

Chart of total period Pösing
Global radiation from 22.05.2007 to 25.04.2024
Note: The time series in the selected period has gaps.
| Date | Global radiation [Wh/m²] |
|---|---|
| 25.04.2024 | 3762.8 |
| 24.04.2024 | 3463.9 |
| 23.04.2024 | 2001.3 |
| 22.04.2024 | 5241.6 |
| 21.04.2024 | 1720.0 |
| 20.04.2024 | 2752.6 |
| 19.04.2024 | 1907.4 |
© Bayerisches Landesamt für Umwelt 2024