
- Start >
- Meteorology >
- Global radiation >
- Untere Donau >
- Pösing >
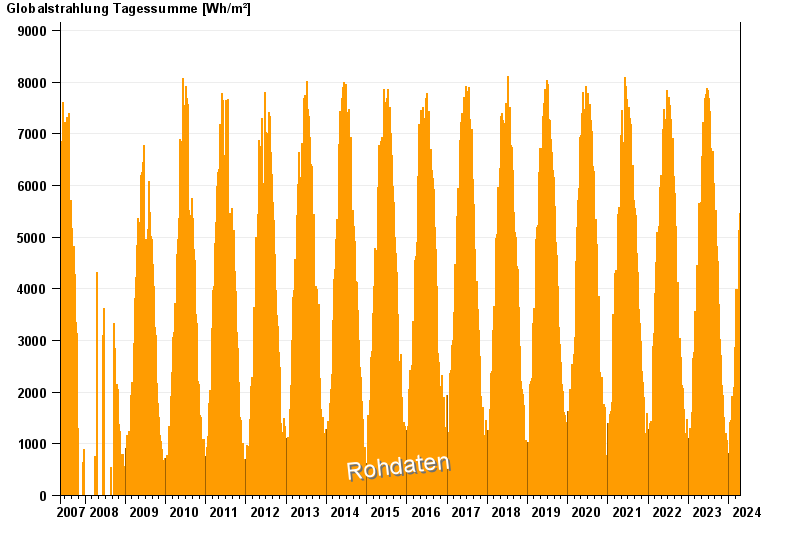
- Chart of total period

Chart of total period Pösing
Global radiation from 22.05.2007 to 19.04.2024
Note: The time series in the selected period has gaps.
| Date | Global radiation [Wh/m²] |
|---|---|
| 19.04.2024 | 437.3 |
| 18.04.2024 | 3115.0 |
| 17.04.2024 | 2634.3 |
| 16.04.2024 | 2399.7 |
| 15.04.2024 | 1931.9 |
| 14.04.2024 | 4501.8 |
| 13.04.2024 | 5294.2 |
© Bayerisches Landesamt für Umwelt 2024