
- Start >
- Meteorology >
- Global radiation >
- Naab - Regen >
- Eschlkam >
- Chart of total period

Chart of total period Eschlkam
Global radiation from 06.07.2017 to 08.05.2024
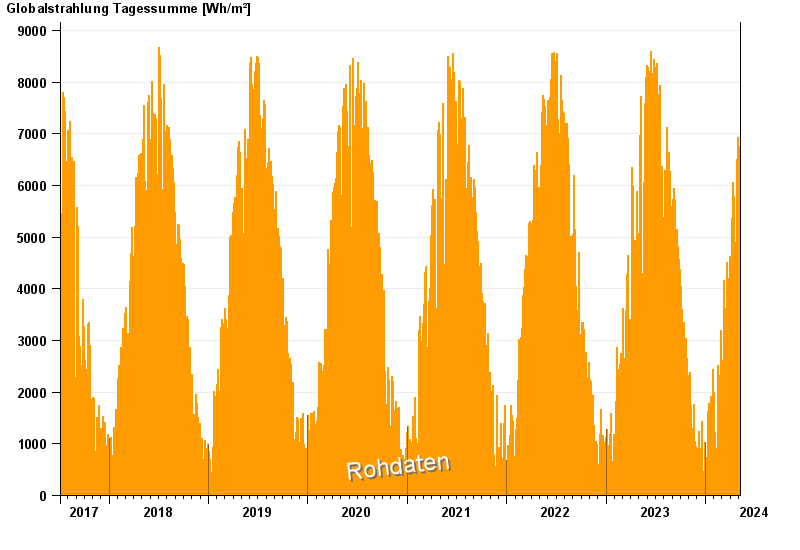
Note: The time series in the selected period has gaps.
| Date | Global radiation [Wh/m²] |
|---|---|
| 08.05.2024 | 2093.5 |
| 07.05.2024 | 1374.1 |
| 06.05.2024 | 5132.2 |
| 05.05.2024 | 4140.7 |
| 04.05.2024 | 5394.2 |
| 03.05.2024 | 1409.8 |
| 02.05.2024 | 4731.7 |
© Bayerisches Landesamt für Umwelt 2024