
- Start >
- Meteorology >
- Global radiation >
- Naab - Regen >
- Eschlkam >
- Chart of total period

Chart of total period Eschlkam
Global radiation from 06.07.2017 to 26.04.2024
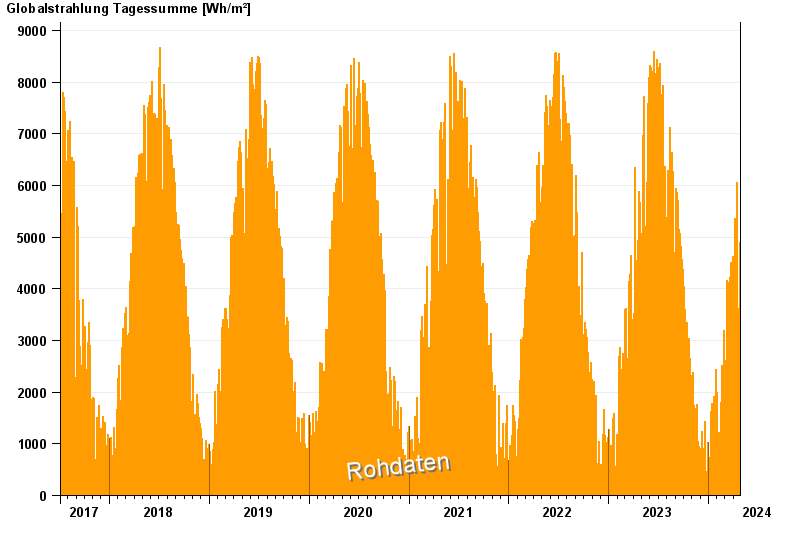
Note: The time series in the selected period has gaps.
| Date | Global radiation [Wh/m²] |
|---|---|
| 26.04.2024 | 6501.5 |
| 25.04.2024 | 3834.8 |
| 24.04.2024 | 4241.7 |
| 23.04.2024 | 2444.8 |
| 22.04.2024 | 4895.2 |
| 21.04.2024 | 1964.7 |
| 20.04.2024 | 3087.5 |
© Bayerisches Landesamt für Umwelt 2024