
- Start >
- Meteorology >
- Global radiation >
- Unterer Main >
- Ettleben >
- Chart of total period

Chart of total period Ettleben
Global radiation from 10.08.1994 to 26.04.2024
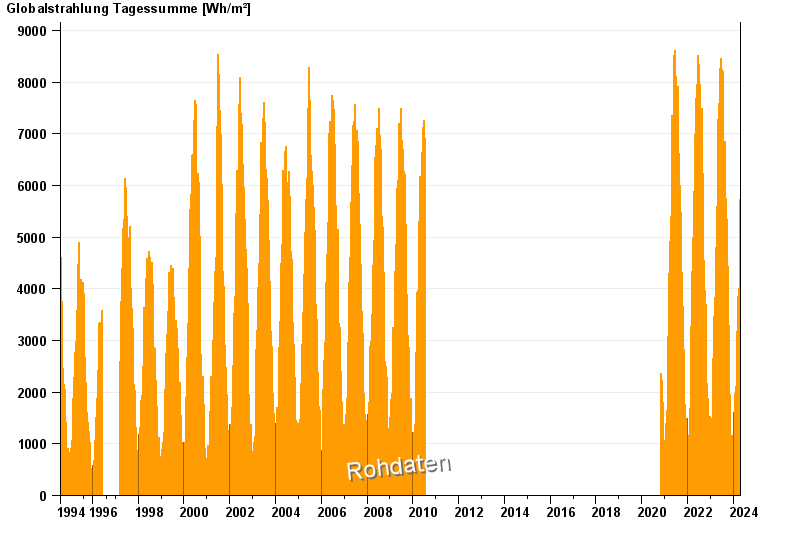
Note: The time series in the selected period has gaps.
| Date | Global radiation [Wh/m²] |
|---|---|
| 26.04.2024 | 3460.4 |
| 25.04.2024 | 3725.6 |
| 24.04.2024 | 3013.1 |
| 23.04.2024 | 6870.9 |
| 22.04.2024 | 4495.5 |
| 21.04.2024 | 1163.8 |
| 20.04.2024 | 4370.6 |
© Bayerisches Landesamt für Umwelt 2024