
- Start >
- Meteorology >
- Global radiation >
- Unterer Main >
- Ettleben >
- Chart of total period

Chart of total period Ettleben
Global radiation from 10.08.1994 to 18.04.2024
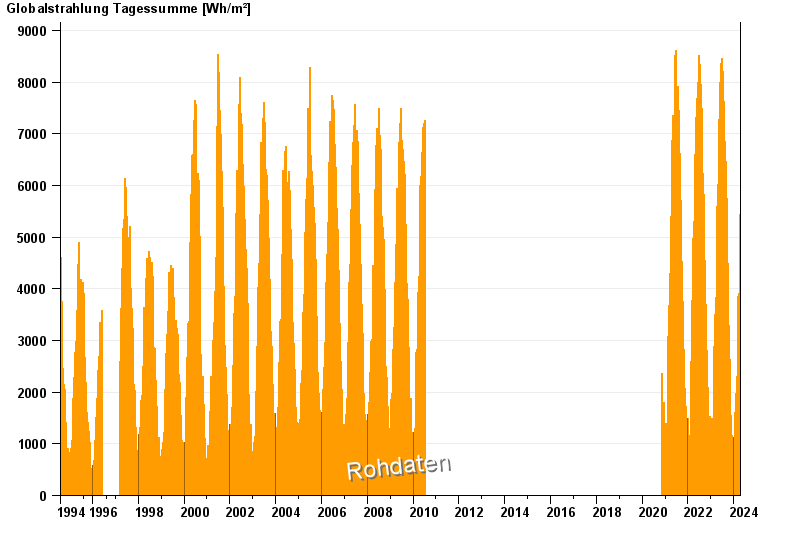
Note: The time series in the selected period has gaps.
| Date | Global radiation [Wh/m²] |
|---|---|
| 18.04.2024 | 1061.4 |
| 17.04.2024 | 4627.0 |
| 16.04.2024 | 3008.8 |
| 15.04.2024 | 3895.5 |
| 14.04.2024 | 4858.7 |
| 13.04.2024 | 5276.2 |
| 12.04.2024 | 5724.7 |
© Bayerisches Landesamt für Umwelt 2024