
- Start >
- Meteorology >
- Global radiation >
- Isar >
- Obersöchering >
- Chart of total period

Chart of total period Obersöchering
Global radiation from 06.07.2016 to 21.08.2023
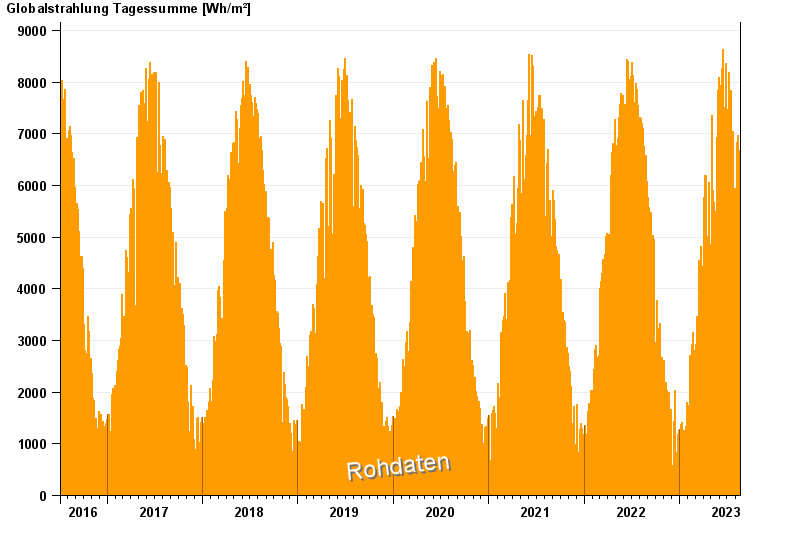
Note: The time series in the selected period has gaps.
note
Derzeit nicht verfügbar
| Date | Global radiation [Wh/m²] |
|---|---|
| 21.08.2023 | 4.9 |
| 20.08.2023 | 6418.3 |
| 19.08.2023 | 6391.2 |
| 18.08.2023 | 6369.9 |
| 17.08.2023 | 5297.7 |
| 16.08.2023 | 6669.7 |
| 15.08.2023 | 4692.8 |
© Bayerisches Landesamt für Umwelt 2025